CIRCULACIÓN Y MEZCLA EN EL FIORDO RELONCAVÍ, CHILE
|
|
|
- María Pilar Marín Miranda
- hace 7 años
- Vistas:
Transcripción

1 Universidad de Concepción Dirección de Postgrado Facultad de Ciencias Naturales y Oceanográficas Programa de Doctorado en Oceanografía CIRCULACIÓN Y MEZCLA EN EL FIORDO RELONCAVÍ, CHILE MANUEL IGNACIO CASTILLO SILVA CONCEPCIÓN-CHILE 2012 Profesor Guía: Oscar Pizarro Arriagada Depto. de Geofísica, Facultad de Ciencias Físicas y Matemáticas Universidad de Concepción
2 Universidad de Concepción Dirección de Postgrado La Tesis Doctoral en Oceanografía Circulación y mezcla en el fiordo Reloncaví, Chile del Sr. Manuel Ignacio Castillo Silva, realizada en el Departamento de Oceanografía, Facultad de Ciencias Naturales y Oceanográficas, Universidad de Concepción, ha sido aprobada por la siguiente Comisión de Evaluación: Dr. Oscar Roberto Pizarro Arriagada Profesor Guía Universidad de Concepción Dr. Arnoldo Valle-Levinson Miembro Comité de Tesis Universidad de Florida Dr. Mario Cáceres Muñoz Miembro Comité de Tesis Universidad de Valparaíso Dr. José Garcés-Vargas Evaluador Externo Universidad Austral de Chile Dr. Rubén Escribano Veloso Director de Programa Universidad de Concepción 24 de Septiembre de 2012.
3 la teoría es asesinada tarde o temprano por la experiencia. Albert Einstein Dedicada a mi esposa, y a mis hijas
4 Índice de Contenidos Agradecimientos... i Curriculum Vitae... ii Resumen... v Abstract... vii 1.- INTRODUCCION Dinámica de estuarios y fiordos: definición y clasificación Dinámica de los fiordos Chilenos: estado actual Conocimiento de la dinámica del fiordo Reloncaví Hipótesis Hipótesis Hipótesis Objetivos Objetivo General Objetivos Específicos MATERIAL Y MÉTODOS Área de estudio Mediciones de CTD-Oxígeno y Fluorescencia (CTDOF) Mediciones meteorológicas Registro de descargas de los ríos y mediciones de nivel del mar Mediciones de ADCPs anclados Mediciones de ADCPs remolcados RESULTADOS Capítulo 1. Dinámica submareal en un fiordo profundo del sur de Chile Capítulo 2. Variabilidad estacional de la hidrografía, el flujo de sal y la mezcla en un fiordo profundo del sur de Chile... 36
5 4.- DISCUSIÓN Rol de la batimetría/constricciones sobre la circulación inducida por densidad Rol del viento sobre la variabilidad de las corrientes a lo largo Circulación submareal: balances de momentum al interior del fiordo Reloncaví Estacionalidad de la Temperatura (T), salinidad (S), oxígeno disuelto (OD) y clorofila-a (Chl-a) Mezcla y Estratificación al interior del fiordo Reloncaví Oscilaciones de baja frecuencia (>1 día) en el fiordo Reloncaví CONCLUSIONES Comentarios Finales REFERENCIAS BIBLIOGRÁFICAS... 84
6 Agradecimientos A mi esposa Mª Stefanía por su infinita paciencia y amor, y a mis queridas hijas Sofía y Amelia por regalarme alegría infinita. A mis padres, sin ellos no sería nadie. A mi profesor guía Oscar Pizarro Arriagada. Su guía me ha otorgado confianza, justo en los momentos necesarios, su compromiso con mi trabajo logró darme la energía necesaria para terminar. A los miembros de Grupo de Oceanografía Física y Clima (OFC), Winston, Susana, Úrsula y Nadin, sin cuyo profesionalismo no habría sido posible realizar las mediciones, además de su apoyo en el posterior control de calidad de los datos. A mi amigo Luis, un amigo constante, un excelente ser humano y colega, y a su querida Norma, quienes han formado parte de nuestra familia acá en Concepción. Al Programa COPAS-Sur Austral y al Fondo de Investigación Pesquera (FIP), por el financiamiento de las campañas de mediciones 2008/2009 en el fiordo Reloncaví. Agradezco el apoyo financiero que me otorgaron las siguientes Instituciones: A las becas de CONICYT de Doctorado (D ), y de apoyo (AT ). Al Programa COPAS quién me otorgó una beca de Término de tesis. La estadía Doctoral en la Universidad de Florida, EE UU de América fue financiada por MECESUP (UCO0602). Al Programa Regional de Oceanografía Física y Clima de la Universidad de Concepción por permitirme trabajar en un espacio que promueve el trabajo multidisciplinario. La información del corrientes del año 2006 fue obtenida a través del proyecto CONA-CF del Comité Oceanográfico Nacional de Chile. i
7 Curriculum Vitae Manuel Ignacio Castillo Silva Nacido el 11 de Agosto, 1973 Viña del Mar, Chile : Oceanógrafo, Pontificia Universidad Católica de Valparaíso, Chile : Doctor en Oceanografía, Universidad de Concepción Chile. PUBLICACIONES Castillo, M. I., Cifuentes, U., O. Pizarro & L. Djurfeldt. en revisión. Seasonal variability of hydrography, salt fluxes and internal mixing in a fjord of southern Chile. Estuarine, Coastal and Shelf Science (ECSS-D ). Castillo, M. I., O. Pizarro, U. Cifuentes, N. Ramírez & L. Djurfeldt. aceptado. Subtidal dynamics in a deep fjord of southern Chile. Continental Shelf Research. doi: /j.csr Tapia, F., M. I. Castillo, J. L. Largier & S. Navarrete. en revisión. Latitudinal discontinuity of inner-shelf temperature variability and driving processes along central-northern Chile. Continental Shelf Research (CSR2671). Tapia, F., S. Navarrete, M. Castillo, B. Menge, J.C. Castilla, J. Largier, E. Wieters, B. Broitman & J.A. Barth Thermal indices of upwelling effects on inner-shelf habitats. Progress in Oceanography, 83 (1-4), Aiken, C., M. Castillo & S. Navarrete Aspects of the Wind-driven Circulation on the central Chilean coast. Continental Shelf Research, 28: Aiken, C., S.A. Navarrete, M. Castillo & J.C. Castilla Along-shore Larval Dispersal Kernels in a Numerical Ocean Model of the central Chilean Coast. Marine Ecology Progress Series, 330: Molinet C, A. Valle-Levinson, C. Moreno, M. Cáceres, M. Bello & M. Castillo Effects of sill processes on the distribution of epineustonic competent larvae in a stratified system of Southern Chile. Marine Ecology Progress Series, 324: Cáceres M., A. Valle-Levinson, C. Molinet, M. Castillo, M. Bello & C. Moreno Lateral variability of flow over a sill in channel of southern Chile. Ocean Dynamics. DOI: /s y. ii
8 ÁREAS DE INVESTIGACIÓN Principal: Oceanografía Física Secundaria: Dinámica de Fiordos Otras: Oceanografía Costera e interacción Físico-Biológica. EXPERIENCIA DOCENTE - Profesor de pregrado de Análisis de Datos, Oceanografía, Pontificia Universidad Católica de Valparaíso Ayudante cursos de pregrado, Oceanografía Física, Universidad de Concepción Profesor a Honorarios de Dinámica de Estuarios, en carrera de Geofísica, Universidad de Concepción Miembro comisión de Tesis de Jorge Henríquez, titulada: Hidrografía y tiempos de Renovación de las aguas sobre el nivel del sill del fiordo Aysén. Biología Marina, Universidad de Concepción. Octubre Evaluador externo de habilitación Profesional de Valentina Olmos, titulada: Estimación de los tiempos de recambio en la capa salobre en fiordos de la norpatagonia chilena. Geofísica, Universidad de Concepción. Enero Evaluador externo de habilitación Profesional de Héctor Verdejo, titulada: Implementación de un modelo hidrodinámico bidimensional para el estudio de la circulación en fiordos. Geofísica, Universidad de Concepción. Abril Miembro de la comisión de Tesis de Úrsula Cifuentes, titulada: Variabilidad estacional de las condiciones oceanográficas y tiempos de renovación en el fiordo Reloncaví (41º 35 S, 72º 30 W), Oceanografía, Pontificia Universidad Católica de Valparaíso. Agosto, Miembro de la comisión de Tesis de Rubén Alexis Luna Aguayo, titulada: Influencia estacional e interanual de la pluma del río Biobío sobre la hidrografía del golfo de Arauco, Biología Marina, Universidad de Concepción. Agosto, Miembro de comisión Tesis de Nadin Ramírez, titulada Seiches en el fiordo Reloncaví. Oceanografía, Pontificia Universidad Católica de Valparaíso. En desarrollo. - Miembro comisión de Tesis de Cristián Ruiz, titulada: Transición primaveral de las corrientes sobre la plataforma continental frente a Concepción, Oceanografía, Pontificia Universidad Católica de Valparaíso. En desarrollo. iii
9 - Miembro de comisión de Tesis de Roxana Rodríguez, titulada: Análisis de estructuras hidrográficas de sub-mesoescala en el océano frente a la zona central de Chile mediante planeadores marinos. Oceanografía, Pontificia Universidad Católica de Valparaíso. En desarrollo. CRUCEROS OCEANOGRÁFICOS Previo al año 2005, formé parte de variados cruceros de Investigación y de apoyo a la navegación como Jefe del Programa de Corrientes del Departamento de Oceanografía del Servicio Hidrográfico y Oceanográfico de la Armada de Chile. Crucero de Investigación del Fiordo Reloncaví, campañas de 15 días de mediciones en los meses de Agosto y Noviembre de 2008, además de Febrero de Proyecto FIP/COPAS Sur Austral. Crucero de Investigación del Fiordo Aysén, campañas de 15 días de mediciones durante los meses de Septiembre de 2009 y Julio de Proyecto INNOVA Aysén/COPAS Sur Austral. Crucero de Investigación Estrecho de Magallanes. Junio de ESTADÍAS DE INVESTIGACIÓN O ENTRENAMIENTO Estadía de Investigación en el Departamento de Ingeniería Civil y Costera de la Universidad de Florida. Laboratorio del Dr. Arnoldo Valle-Levinson, Estados Unidos de América. Octubre de iv
10 Resumen Circulación y mezcla en el fiordo Reloncaví, Chile Manuel Ignacio Castillo Silva Doctor en Oceanografía Universidad de Concepción, 2012 Dr. Oscar Pizarro A., Profesor Guía El Fiordo Reloncaví (RF) es uno de los fiordos más cercanos al ecuador geográfico, este se localiza cerca de los S, tiene una longitud aproximada de 55 km y un ancho máximo de 4 km. Aunque ha sido uno de los fiordos usados más intensamente para la acuicultura en Chile durante las últimas décadas, sus condiciones oceanográficas y la circulación de sus aguas son muy poco conocidas. El objetivo principal de la presente investigación fue analizar la dinámica de las corrientes submareales del RF y caracterizar sus condiciones hidrográficas durante invierno 2008 y verano Para este fin, se usaron series de tiempo de corrientes, vientos y descarga del río Puelo. Adicionalmente, se utilizaron registros estacionales de temperatura (T), salinidad (S), oxígeno disuelto (OD) y fluorescencia/clorofila-a (Chl-a. El estudio mostró que la capa superior posee un espesor del orden de 8 m cerca de la cabeza y menos de 2 m en torno a la boca, el aporte de agua dulce regula la salinidad superior, que además es sostenida por la mezcla vertical a lo largo de todo el fiordo. La hidrografía mostró una marcada variabilidad estacional. La estructura de las isopicnas indicó un máximo relativo de presión (alta presión) en superficie en el centro del fiordo, debido al gran aporte de agua dulce del río Puelo. Este aporte fluvial en el centro del fiordo, junto a la máxima curvatura del fiordo en ese lugar, podrían ser factores que modifican los balances dinámicos localmente. El viento presentó un claro patrón estacional, con una dirección predominante hacia el exterior del fiordo en invierno y hacia el interior en primavera-verano, además en este último periodo el viento presentó un marcado ciclo diario. La columna de agua muestra una intensa estratificación vertical tanto en invierno como en verano, siendo más intensa durante el periodo de invierno. En términos de los balances dinámicos submareales a lo largo del fiordo, los términos advectivos fueron los responsables de balancear el gradiente de presión, mientras que en el eje transversal, el balance mostró ser aproximadamente geostrófico. La v
11 relación entre los perfiles medios de las corrientes observadas y el perfil medio de velocidad geostrófica fue altamente significativa (R 2 =0,79). La presencia de oscilaciones internas tipo seiche fueron distinguibles en los espectros de corrientes (periodo de 3 días), estas se presentaron mucho más marcadas durante primavera-verano y su energía podría incrementar la mezcla interna del fiordo. Otro tipo de oscilaciones de más baja frecuencia (~10-15 días) pueden propagarse desde el exterior del fiordo y su forzamiento podría provenir de oscilaciones en el campo de vientos regional o a oscilaciones mareales. En fiordos sin un umbral tan evidente, como en el RF, es posible que tanto oscilaciones internas naturales (tipo seiche) y oscilaciones provenientes desde el exterior del fiordo contribuyan significativamente a la ventilación y mezcla del fiordo. El análisis de la variabilidad estacional de las estructuras de T, S, OD y Chl-a, a lo largo del fiordo, mostraron una delgada capa superficial (entre 4-8 m) de agua salobre (salinidades < 10) y bajo esta una capa extensa que se extiende hasta el fondo de las cuencas con salinidades > 10 y < 33. Se apreciaron relativamente altas concentraciones de OD (> 6 ml L -1 ) y Chl-a (>10 mg m -3 ) durante el verano en torno a los 7 m de profundidad. Las concentraciones de Chl-a pueden estar asociadas a una producción in-situ, distinto a lo observado durante el verano, donde las bajas concentraciones de clorofila (< 1 mg m -3 ) sugieren la intrusión de aguas al fiordo. En otoño, bajo los 50 m las aguas son relativamente más saladas (> 32,6) y cálidas (> 10,7ºC) que durante el verano, mediciones en el exterior del fiordo (en el Seno Reloncaví) sugieren que estas aguas tienen un origen oceánico con tiempos de residencia lo suficientemente largos para reducir su OD bajo los 3 ml L -1. Estas concentraciones de OD fueron observados en la capa profunda del fiordo en verano y otoño. El agua salobre de la capa superior posee un tiempo de descarga de 9.4 días durante el verano (considerando el fiordo completo), mientras que durante el invierno este tiempo se reduce a 4,3 días. El análisis del número de Richardson (Ri) indicó que condiciones de mezcla (Ri< 0,25) se presentan en muy pocas oportunidades (~ 8% de los casos), lo cual indica que el fiordo mantiene su estratificación en invierno y verano, y sólo en limitadas ocasiones (principalmente durante invierno) se presentan condiciones favorables para la mezcla. Palabras Claves: Fiordo, balance de momentum, submareal, geostrofía, mezcla, número de Richardson. vi
12 Abstract Circulation and mixing in the Reloncavi fjord, Chile. Manuel Ignacio Castillo Silva Doctor en Oceanografía Universidad de Concepción, 2012 Dr. Oscar Pizarro A., Profesor Guía The Reloncavi fjord (RF) is one of the most equatorward fjords of world, this fjord present 55 km length and a maximum wide of 4 km. Although, the RF has been intensively used for aquaculture in last decades in Chile, its oceanographic conditions and circulation is little know. The main objective of this study was analyze the subtidal dynamic of the currents and hydrography during winter 2008 and summer To accomplish this objective, time series of currents, winds and the Puelo river discharge were used. Additionally, the study used the distribution of temperature (T), salinity (S), dissolved oxygen (DO) and fluorescence/chlorophyll (Chl-a) to characterized the seasonality of those variables in the RF. The upper brackish layer present 8 m depth at the fjord s head and less than 2 m around the fjord s mouth. The upper layer salinity is supply by the mixing along the fjord. The hydrography showed a clear seasonal variability, where the isopycnals structure showed the existence of marked pressure gradient at the center of the fjord due to the Puelo River influence. The freshwater supply at the center of the fjord and the maxima curvature of the region modify the dynamics balances locally. The winds showed a marked seasonal pattern, out-fjord during winter and up-fjord during spring-summer, also in this season winds showed a clear daily cycle. The region, showed an intense stratification Ri> 0.25 in winter and summer but in summer, this stratification was more intense. The along-fjord subtidal dynamic balance showed that the advective terms were responsible to balance the along-fjord pressure gradient, at cross-fjord the dynamic balance was quasi-geostrophic, here the comparison between the observed along-fjord current profiles and the geostrophic velocities showed a significant correlation R 2 =0.79. Internal oscillations of typical periods of 3 days were observed in the along-fjord spectrums; these oscillations were consistent with an internal seiche and those oscillations were more evident during the spring-summer period, the energy associated to vii
13 these oscillations could increase the mixing on the fjord. Another type of low-frequency internal oscillations presented a days of period, the results suggest that the origin of those perturbations could be outside of the RF, similar period of oscillation was observed in the regional field of winds outside the RF but also this oscillations could be generated by fortnightly tides. In fjords with deep-sill, as the RF, it is possible that those low-frequency oscillations, e.g. due to internal seiche or days oscillations could contribute to the internal mixing and ventilation of fjords. The seasonal variability of the along-fjord structures of temperature, salinity, dissolved oxygen (DO) and chlorophyll/fluorescence (Chl-a) shows a thin upper layer (between 4-8 m depth) with brackish waters (salinities < 10) over a thick deep layer which occupied until the bottom of the basins with salinities between 10 and 33. The relatively high DO (> 6 ml L -1 ) and high Chl-a (> 10 mg m -3 ) at ~7 m depth observed during summer, could be related with an in-situ production, different to the summer where lower Chl-a (< 1 mg m -3 ) suggest the intrusion of external waters to the RF. During autumn, below 50 m depth the waters were relatively salty (> 32.6) and warmers (> 10.7ºC) than summer. Comparisons with observations outside of the RF (into the Reloncavi sound) suggest the oceanic origin of those waters with residence times enough to reduce their DO below 3 ml L -1, this levels of DO were observed near the bottom in summer and autumn. The brackish waters of the upper layer presented flushing times of 9.4 days during summer whereas in winter this time was 4.3 days. The Richardson number (Ri) analysis indicated that the mixing conditions (Ri< 0.25) were present only in the ~ 8% of cases, which imply that the fjord maintain their stratification along the seasons and only during limited occasions (mainly during winter) there were favorable conditions for mixing. Key words: Fjord, momentum balance, subtidal, geostrophic, mixing, Richardson number. viii
14 1.- INTRODUCCIÓN 1.1. Dinámica de estuarios y fiordos: definición y clasificación. Los estuarios son cuerpos de agua costeros semi-cerrados que conforman la transición entre uno o varios ríos y el océano. Las características de la transición están determinadas por la combinación entre la circulación y el gradiente salino. Un tipo especial de estuario son los fiordos: su estructura de densidad es altamente estratificada y su geomorfología se debe al avance y retroceso glacial (Dyer 1973; Syvitski et al. 1987). Por una parte, estas áreas presentan ventajas ambientales que favorecen su utilización, razón por la cual, importantes asentamientos humanos se encuentran estrechamente ligados a zonas estuarinas (Lindeboom 2002) y por otra, el aumento significativo del uso de los fiordos con propósitos productivos, ha incrementado la preocupación acerca de la capacidad de estos ambientes para mantener la concentración de oxígeno disuelto y nutrientes en niveles que no son críticos para el buen funcionamiento del ecosistema (Diaz 2001). A manera de ejemplo, las actividades derivadas de la acuicultura industrial pueden generar impactos directos o indirectos sobre estos ambientes (Gillibrand & Turrell 1997; Bhatta & Bhat 1998; Wilson 2002; Stigebrandt et al. 2004; Holmer et al. 2008) e incluso, generar el colapso completo del sistema (Kennish 2002). Las zonas estuarinas pueden ser clasificadas en diferentes formas de acuerdo a su balance de aguas, su geomorfología, su estructura vertical de salinidad, o su hidrodinámica (Pickard 1961; Hansen & Rattray 1966; Stigebrandt 1981). Recientemente, Valle-Levinson (2008, 2010) resume y actualiza estas clasificaciones y centra su atención en la clasificación en base a la estructura lateral del flujo. Los fiordos adicionalmente pueden clasificarse por su régimen climático, de esta forma encontramos fiordos: polares, subpolares y temperados (Inall & Gillibrand 2010). Los fiordos polares permanecen prácticamente siempre cubiertos de hielo (e.g.. en Groenlandia, Ártico Canadiense y la mayor parte de la Antártica), mientras que los fiordos subpolares están ubicados en áreas donde la temperatura media del verano supera los 0ºC; durante el invierno es posible que el océano se congele para derretirse en verano (e.g.. Svalbard, el oeste de Groenlandia y la península Antártica). En cambio, en los fiordos temperados, el océano no se 1
15 congela y la mayoría de ellos no posee un glacial asociado (e.g.. Islandia, Alaska, Chile, Noruega, Escocia y Nueva Zelanda). De esta forma, Syvitski et al., (1987) esquematizaron la localización de los fiordos en el cinturón de fiordos del norte y del sur (Fig. 1). Figura 1. Localización de las principales áreas de fiordos en el mundo (Figura modificada de Howe et al., 2010). Asimismo, los fiordos y estuarios representan verdaderos laboratorios en donde es posible analizar con mayor detalle, procesos que en el océano ocurren a mayor escala temporal y espacial (Dyer 1973). En el desarrollo de esta dinámica, el aporte de agua dulce es fundamental y pueden provenir de la descarga de ríos, del deshielo de glaciares, de la precipitación directa u otras fuentes como el escurrimiento freático, estos últimos, difíciles de cuantificar; además, representan una fuente de nutrientes, sedimentos y, en general, de diversos materiales en suspensión relevantes para los procesos biogeoquímicos que ocurren al interior de estos ambientes (Bourgault 2001; Bowen 2000; Cameron & Pritchard 1963; Macdonald 2003; Sommerfield & Nittrouer 1999). 2
16 El aporte de agua dulce genera un gradiente de presión a lo largo del fiordo y un flujo superficial asociado dirigido desde la cabeza hacia la boca del fiordo. La mezcla turbulenta transporta sal (hacia arriba) y agua dulce (hacia abajo) entre las capas superficial y profunda, promoviendo la entrada de agua de mar al fiordo bajo la capa superficial, lo que trae como consecuencia la generación de un patrón medio de corrientes en dos capas: la superficial se dirige hacia la boca y la inferior hacia la cabeza. Este patrón se conoce como circulación estuarina o gravitacional (Dyer 1973; Officer 1976; Farmer & Freeland 1983). En estuarios profundos como los fiordos, existe además, una circulación profunda, que en fiordos con umbral (sill), puede permanecer desacoplada de la circulación estuarina cercana a la superficie, debido a que el sill comúnmente limita el intercambio del agua profunda del fiordo, limitando su ventilación (Stigebrandt 1981). Al interior de esta cuenca profunda, el agua puede permanecer prácticamente estancada con un tiempo de residencia de órdenes de magnitud mayor que en las capas superficiales (Arneborg et al. 2004). La circulación estuarina puede ser afectada por diversos factores, tales como: la influencia mareal, el esfuerzo del viento, la batimetría, factores externos (ej. variación del campo de presión atmosférica regional, cambios significativos del aporte de agua dulce), los cuales afectan en diferentes grados en la dinámica de estos ambientes (Inall & Gillibrand 2010; Stigebrandt 2012). Algunos de estos procesos se presentan en la figura 2. La mezcla entre la capa de agua salobre y la capa salina es un mecanismo retroalimentador de la circulación estuarina. En este tipo de ambientes altamente estratificados, la mezcla se produce en la interfase; en estado sub-crítico este tipo de mezcla es llamado entrainment, en estado crítico o super-crítico la mezcla se produce por difusión turbulenta (Grubert 1990). Los procesos de mezcla y ventilación son muy difíciles de cuantificar mediante observaciones, tanto en zonas oceánicas como en fiordos, sin embargo, se han efectuado estudios con el objetivo de cuantificar mediante parametrizaciones los coeficientes turbulentos de difusión (para el balance de masa o sal) y de viscosidad (para el balance de momentum). Una de las parametrizaciones más utilizadas tanto en el océano abierto como en fiordos es la sugerida por Pacanowski & Philander (1981), quienes estiman estos parámetros a través del número de Richardson (Ri), el cual requiere de mediciones de alta resolución vertical y temporal en profundidad, tanto de corrientes como de salinidad y temperatura. En los últimos años se han 3
17 realizado mediciones directas de la turbulencia en fiordos mediante instrumentos especializados en micro-estructura (Peters & Bokhorst 2000; Peters & Bokhorst 2001; Arneborg et al. 2004). En fiordos con umbral este proceso puede ser el responsable de ventilar las cuencas más profundas, mientras que en fiordos sin umbral es posible que otros procesos (ej. variaciones del campo de densidad en el exterior, oscilaciones internas de origen remoto) aporten a la mezcla interna del fiordo. Figura 2. Esquema de los principales procesos que ocurren al interior de los fiordos (Figura tomada de Inall & Gillibrand, 2010) Dinámica de los fiordos chilenos: estado actual La zona de canales y fiordos chilenos se encuentra dentro de las zonas de fiordos más extensas del mundo (Cameron & Pritchard 1963; Officer 1976; Silva et al. 2009). Esta zona comprende más de 1700 km de largo (~40% del largo total de Chile) entre las latitudes 41,5ºS y los 55,9ºS en la zona al interior del cinturón de fiordos del sur (Fig. 1). La morfología de esta zona es el resultado combinado de la acción erosiva glacial y el hundimiento de valles longitudinales (Araya-Vergara et al. 2008; Silva et al. 2009). El conocimiento de estas áreas ha sido limitado. Como ejemplo, entre Puerto Montt y Laguna San Rafael sólo se habían realizado un par de expediciones extranjeras y chilenas (Vargas 1983; Sievers & 1994), mientras que al sur del Golfo de Penas se contaba con 4
18 información de algunos cruceros de investigación que navegaban a través del Estrecho de Magallanes (Brambati 1991; Faranda & Guglielmo 1991; Arntz & Gorny 1996; Faranda et al. 1996). Uno de los primeros resultados de estos estudios oceanográficos, mostró la existencia de grandes similitudes entre el sistema de fiordos de Chile y los sistemas de la Columbia Británica y Alaska (Pickard 1971; Officer 1976). Lo anterior motivó en 1994 al Comité Oceanográfico Nacional (CONA) a diseñar un programa de investigación de los canales y fiordos australes, el cual se denominó Cruceros de Investigación Marina en Áreas Remotas (CIMAR) (Silva & Palma 2006; Pantoja et al. 2011). A la fecha, el programa CIMAR ha realizado más de 18 cruceros de investigación, con una producción científica que abarca diversos tópicos en más de 100 publicaciones en revistas nacionales y extranjeras, destacando el desarrollo de más de una veintena de tesis de pregrado y postgrado. Aun cuando se han realizado una serie de campañas de medición en estas áreas (a través de los CIMAR), gran parte de estos análisis han orientado sus resultados en describir la estructura vertical/espacial de temperatura, salinidad, oxígeno y fluorescencia (Silva et al. 1995; Pinochet & Salinas 1996; Silva et al. 1998; Guzmán & Silva 2002; Calvete & Sobarzo 2011). En base a estas distribuciones de las propiedades de las aguas, se han efectuado esquemas de la circulación en el mar interior de Chiloé, indicando la existencia de una circulación superior saliendo de los fiordos (0-50 m), una intermedia con ( m) con aguas de origen subantártico que fluye al interior y una circulación profunda (> 150 m) de muy limitada extensión (Silva et al. 1998; Silva & Palma 2006) (Fig. 3). Parte de la información recopilada en los proyectos CIMAR ha sido útil para los planteamientos expuestos en el Capítulo 2 del presente estudio. En la zona de fiordos y canales se han realizado esfuerzos importantes para cuantificar el impacto de los aportes de agua dulce en la zona costera proveniente de los ríos, los deshielos y la precipitación se han realizado esfuerzos para cuantificar el impacto de estos 5
 en la zona comprendida entre los 35ºS y 55ºS el aporte total de agua dulce a la zona costera es del orden de 33,5 x 10 3 m 3 s -1 (esta descarga considera tanto el aporte de los ríos como el")
19 aportes en la zona costera. De acuerdo al estudio efectuado por Dávila et al. (2002) en la zona comprendida entre los 35ºS y 55ºS el aporte total de agua dulce a la zona costera es del orden de 33,5 x 10 3 m 3 s -1 (esta descarga considera tanto el aporte de los ríos como el de la precipitación), lo cual tiene un evidente impacto sobre la salinidad superficial de las zona costera. En la zona entre los 43ºS y 47ºS, Calvete y Sobarzo (2010) estimaron la profundidad equivalente de la capa de agua dulce en la zona entre el Canal Moraleda y Estero Elefantes obteniendo una profundidad máxima de 8 m y siempre cercana a la cabeza de los fiordos estudiados. Figura 3. Esquema de la circulación en el mar interior de Chiloé, donde a) representa la circulación típica entre 0-50 m, b) la circulación entre m y c) la circulación a profundidades > 150 m (Figura modificada de Silva y Palma, 2006). Aun cuando no existía un acabado conocimiento de la dinámica de la zona de fiordos y canales chilenos, y tras un plan gubernamental de diversificación de la economía (Buschmann et al. 2009), diversos sectores al interior de la zona entre Puerto Montt y la boca del Guafo comenzaron a ser utilizados, desde inicios de los años ochenta, para el cultivo de salmones y mitílidos. En los próximos años, se proyecta ampliar el área de cultivos hacia los canales de la Patagonia austral tal como se presenta en la figura 4a y 4b ( 6
20 La industria acuícola tuvo un crecimiento tan rápido que, en 2007 llegó a representar el 73% de la producción total de la acuicultura en Chile (Chapman & Wang 2001). Esta situación se mantuvo hasta la aparición y propagación del virus de la anemia del salmón (ISAV) a mediados de 2007 (Mardones et al. 2011). El impacto de este virus en la industria acuícola chilena fue dramático (Fig. 4c). Así, el año 2009 el cultivo de salmones fue 61% más bajo que en años anteriores (Mardones et al., 2011) y aunque hoy en día se ha recuperado a niveles pre- ISAV, podrían no incrementarse hasta el 2015 (Asche et al. 2009). Por lo tanto, cabe realizarse la siguiente pregunta Era posible que con un mayor conocimiento de la dinámica física de los fiordos, se pudiera haber mejorado el manejo de la crisis? Figura 4. a) y b) Áreas actualmente concesionadas y las planificadas de acuerdo a los antecedentes aportados por SERNAPESCA (figura modificada de Fillinger et al., 2011). En tanto que en c) se presenta la extensión del ISAV durante la infección de (figura modificada de Mardones et al., 2011). Aspectos tales como la circulación, difusión horizontal y vertical, la estructura de densidad, las principales escalas de variabilidad espacial y temporal, el rol de los distintos forzantes y, en definitiva, el comportamiento dinámico de la región, eran y continúan siendo muy poco conocidos. En Chile estudios directos de la dinámica de estos sistemas han tenido una limitada cobertura espacial y temporal. Destacables son los esfuerzos observacionales que se han 7
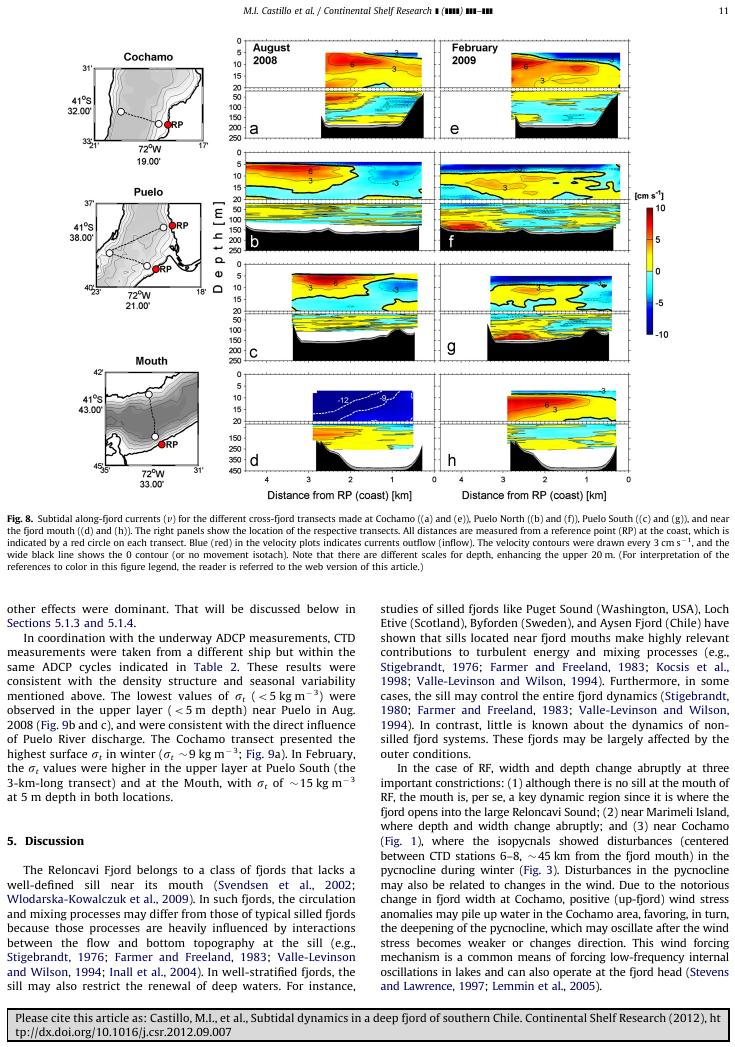
21 realizado en algunos sectores, como por ejemplo en: el canal Chacao (Cáceres et al. 2003), el fiordo Reloncavi (Valle-Levinson et al. 2007; Castillo et al. in press), el mar interior de Chiloé (Cáceres et al. 2008; Letelier et al. 2011), el fiordo Aysén (Cáceres et al. 2002), el canal Moraleda y la constricción de Meninea (Salinas & Hormazábal 2004; Valle-Levinson & Blanco 2004; Salinas et al. 2007), el canal Darwin (Castillo et al., 2006), fiordo Puyuguapi (Cáceres & Valle-Levinson 2004) y en el Estrecho de Magallanes (Salinas et al. 2004; Valle- Levinson et al. 2006). La modelación dinámica de estos ambientes se ha centrado en modelos barotrópicos, y han descrito la propagación de la onda de marea hacia el interior (Aiken 2008; Marín & Campusano 2008). Sin embargo, para mejorar nuestro entendimiento de aspectos fundamentales de la dinámica de estos sectores, es necesario contar con modelos hidrodinámicos que puedan representar adecuadamente los efectos de la estratificación y la naturaleza baroclínica de las corrientes que caracterizan estos ambientes Conocimiento de la dinámica del fiordo Reloncaví En el área exterior del fiordo se encuentra el seno Reloncaví (Fig. 5). Recientes estudios han sugerido que el principal forzante de la variabilidad de las corrientes de ese sector, es la marea; la que explicaría cerca del 75% de la variabilidad (Letelier et al. 2011). Adicionalmente, se han observado corrientes > 20 cm s -1 asociadas a aguas de muy baja salinidad provenientes del fiordo Reloncaví. Sobre estas corrientes, el viento puede jugar un papel más relevante (Soto-Mardones et al. 2009). El fiordo Reloncaví es uno de los más cercanos el ecuador geográfico del mundo (Valle-Levinson et al. 2007; Castillo et al. in press) y fue uno de los primeros utilizados para la salmonicultura en Chile (Soto et al. 2001). Uno de los primeros trabajos descriptivos de este fiordo mostró resultados de 6 cruceros realizados entre 1949 y 1990 y que centró sus observaciones en las características químicas del estuario (Bastén & Clement 1999). Por otra parte, un estudio más reciente sobre la dinámica física del fiordo, fue realizado por Valle- 8
22 Levinson et al (2007), el que reportó una capa boyante de menos de 5 m de espesor, la existencia de un seiche lateral y el desarrollo en promedio de 3 capas de circulación. Figura 5. Área general de la ubicación del fiordo Reloncaví en el contexto conocido como mar interior de Chiloé. El año 2006 el grupo de Oceanografía Física y Clima (OFC) de la Universidad de Concepción efectuó una campaña de mediciones de corrientes e hidrografía en el marco del proyecto CIMAR12, el estudio centró sus objetivos en la circulación a lo largo del estuario con énfasis en las corrientes sub-superficiales y de fondo sin obtener datos del flujo superficial (como parte del presente estudio algunos resultados de estas observaciones se incluyen en el Capítulo 4). Sin embargo, una completa descripción de la circulación estuarina necesita contar con información de la estructura de corrientes, temperatura y salinidad de la capa superficial. En el marco del presente estudio, el OFC-UdeC desarrolló una extensa campaña de mediciones sin precedentes para un fiordo chileno entre Agosto 2008 y Febrero de 2009, logrando describir la estructura de la capa superficial y profunda, tanto a partir de mediciones de corrientes ancladas como remolcadas (ver Capítulo 3.1). 9
23 En la comprensión de la dinámica del Fiordo Reloncaví aún persisten preguntas no clarificadas, por ejemplo: Cuál es el rol de las ondas de baja frecuencia en su interior?, Cómo es el intercambio de sal y la mezcla a lo largo del año?, Cómo afecta la variabilidad del viento al flujo superficial? Los objetivos del presente estudio son abordar parte de estas interrogantes y entregar cuáles son los patrones dominantes de la circulación en el fiordo Reloncaví. Además, los distintos procesos involucrados en la circulación del Fiordo Reloncaví, tienen a su vez relevancia para otras regiones costeras y oceánicas. Se espera que el presente estudio pueda ser un aporte al conocimiento de la dinámica de los fiordos chilenos. 10
24 1.4. Hipótesis Hipótesis I La circulación residual del Fiordo Reloncaví se encuentra determinada por la interacción entre la capa boyante de superficie y la capa inmediatamente inferior, y es modificada significativamente por la rotación terrestre y el esfuerzo del viento Hipótesis II Las variaciones estacionales en el flujo de los ríos y en el viento modulan a escala sinóptica (periodos entre 1 y 15 días) la circulación en el estuario generando oscilaciones baroclínicas (tales como seiches internos), las cuales juegan un papel relevante en la variabilidad de las corrientes al interior del fiordo. 11
25 1.5. Objetivos Objetivo General Determinar los patrones dominantes de la circulación y la mezcla en el Fiordo Reloncaví, y cuantificar el efecto de los forzantes físicos que controlan su variabilidad Objetivos Específicos 1. Caracterizar la circulación gravitacional, y evaluar el rol de algunos factores que modifican la circulación gravitacional, tales como la variabilidad del nivel del mar, el aporte de agua dulce, el esfuerzo del viento y los efectos rotacionales (aceleración centrípeta y Coriolis). 2. Determinar la influencia de las oscilaciones internas tipo seiche en las fluctuaciones subinerciales de las corrientes. 3. Establecer la variabilidad estacional de los forzantes de la circulación en el fiordo Reloncaví. 12
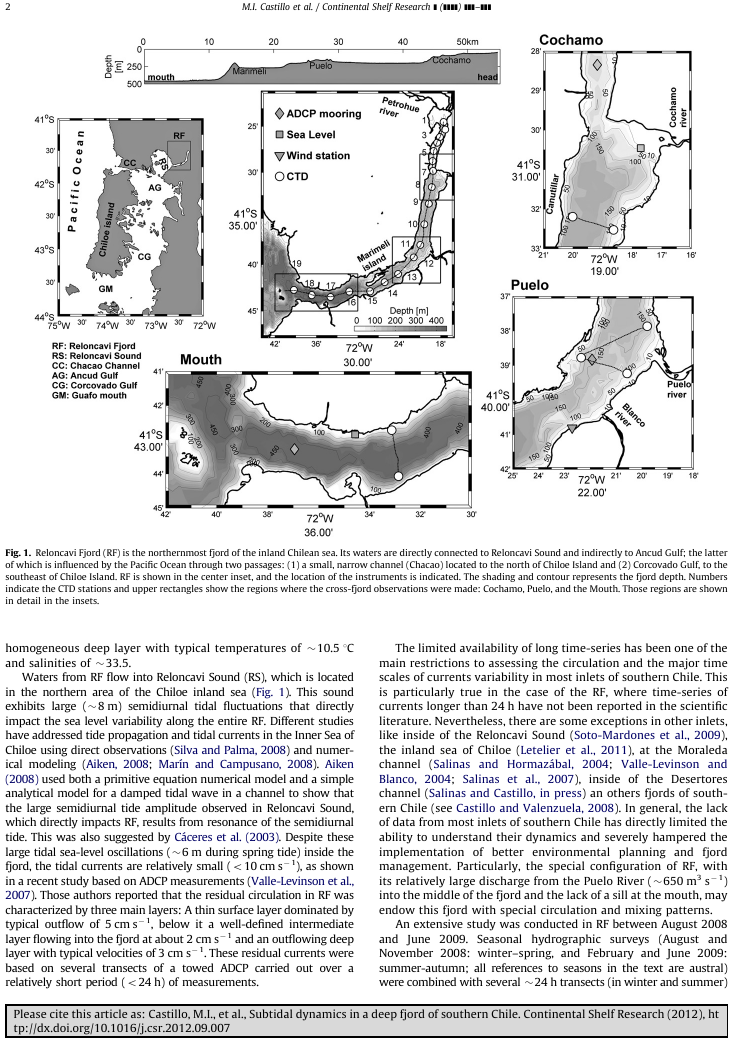
26 2.- MATERIAL Y MÉTODOS En este capítulo se presenta en forma resumida algunos de los antecedentes del área de estudio, además de la información e instrumental utilizado. Antecedentes generales de las observaciones, procesamiento y objetivos asociados se presentan en la Tabla 1. El detalle de cada análisis se puede apreciar en los Capítulos 3.1 y Área de estudio El fiordo Reloncaví se encuentra localizado entre 41º 23 S y los 41º 45 S centrado en los 072º 30 W (Fig. 6). Estudios paleo-geológicos revelan que la geomorfología del estuario se ajusta a un fiordo de origen glacial (Aracena 2005; Araya-Vergara et al. 2008). El fiordo posee un largo desde la cabeza a la boca de 55 km, con un ancho de 3 km. en su parte más amplia (Valle-Levinson et al. 2007). El fiordo presenta una estructura similar a un umbral a 17 km. de la boca cuya mínima profundidad se presenta a 200 m y no parece ser una barrera para la comunicación de las aguas interiores del fiordo con el exterior. Además, es posible identificar cuatro sub-cuencas al interior del fiordo (Fig. 6, Capítulo 3.1 y 3.2). Las principal fuente de agua dulce proviene del río Puelo,el cual posee una media anual de 650 m 3 s -1 (Niemeyer & Cereceda 1984; Aracena 2005; León 2005). Mayor información de las descargas estacionales de los ríos y aportes de agua se efectúa en los Capítulos 3.1 y 3.2. Los vientos del sector tienen una marcada variabilidad estacional donde los vientos del Norte predominan durante el invierno y los del Sur y Suroeste en verano, con magnitudes que por lo general se mantienen por debajo de 9 m s -1 (Saavedra et al. 2010; Letelier et al. 2011) y no exceden los 15 m s -1 (Cáceres et al. 2002; Valle-Levinson & Blanco 2004; Valle-Levinson et al. 2007). Las corrientes del sector son altamente estratificadas, mostrando un patrón de 3 capas, donde la superficial (< 5 m) y la profunda (> 100m) se dirigen hacia la boca y la intermedia se dirige hacia la cabeza (Valle-Levinson et al. 2007). Además, las corrientes mareales son de pequeña amplitud <10 cm s

27 Figura 6. Área de estudio, ubicación del instrumental y estaciones oceanográficas. En la parte inferior se esquematiza la ubicación en la vertical de los ADCPs anclados en cada cuenca. El régimen de mareas del sector proviene de datos y modelación fuera del fiordo. En Puerto Montt el rango de mareas puede alcanzar los 12 m (Cáceres et al. 2003; Valle-Levinson et al. 2007), mientras que en el interior del fiordo, el máximo rango fue menor a 6 m (Valle- Levinson et al. 2007) Mediciones de CTD-Oxígeno y Fluorescencia (CTDOF). Las mediciones se efectuaron mediante el uso de un registrador de temperatura, conductividad y profundidad (CTD) marca SeaBird, modelo 25 con sensores adicionales para la medición de Oxígeno disuelto (SB-43) y un fluorómetro Wet-Lab/Web-Star (ECO-AFL). La información de CTDOF fue colectada en transectas a lo largo y a lo ancho del fiordo. Las 14
28 mediciones a lo largo del fiordo consideraron 19 estaciones de CTDOF, las cuales se efectuaron entre los días: 7-8/Ago-2008 (invierno), 9-10/Nov-2008 (primavera), 6-7/Feb-2009 (verano) y 9-10/Jun-2009 (otoño). Las mediciones a lo ancho solo fueron realizadas durante invierno (10-14/Ago-2008) y verano (8-14/Feb-2009) y estuvieron coordinadas con mediciones de corrientes medidas con ADCP en tiempo real (ADCP remolcado) Mediciones meteorológicas Se instaló una estación meteorológica en el área de Punta Iglesia, ubicada al sur de la desembocadura del río Puelo. La estación estuvo provista de sensores de dirección y magnitud del viento, radiación solar, pluviosidad, presión atmosférica y temperatura del aire, todos los sensores se encontraban ubicados a 10 m. sobre el nivel del mar Registros de la descargas de los ríos y mediciones de nivel del mar Solamente se contó con mediciones de descarga del río Puelo. Esta información fue proporcionada por la Dirección General de Aguas de Chile (DGA, quien posee una estación de mediciones situada 12 km hacia el interior de la desembocadura del río Puelo. Las series de nivel del mar se registraron en el área de Cochamó y la boca del fiordo (Fig. 6). En estas estaciones se instalaron sensores de presión a 1 m sobre el piso marino; en Cochamó se instaló un sensor de acero inoxidable HOBO-U20, mientras que cerca de la boca del fiordo, un olomareógrafo SBE-26plus Mediciones de corrientes: ADCPs anclados Se instalaron 3 líneas ancladas de correntómetros perfiladores acústicos Doppler (ADCP, en sus siglas en inglés) en los sitios que se indican en la Fig. 6. El objetivo principal del diseño de muestreo fue capturar la delgada capa de agua dulce superficial. Para ello los ADCPs superficiales se situaron sobre los 28 m. Las mediciones se llevaron a cabo entre Agosto y Noviembre de 2012 (ver detalles de la ubicación, tiempo de registro y profundidades en la Tabla 1 del Capítulo 3.1). 15
29 El estudio también consideró la utilización de información de corrientes (medidas con ADCPs) obtenida en estos mismos sectores durante la campaña de mediciones CIMAR 12 durante el año Se presentarán algunos de los resultados obtenidos de la combinación de ambas fuentes en el Capítulo 4, como apoyo a los resultados expuestos en el Capítulo Mediciones de corrientes: ADCPs remolcados Se utilizaron dos tipos diferentes de ADCP para obtener registros de corrientes en modo remolcado. Estos ADCPs poseen la capacidad de corregir la velocidad relativa de las corrientes registradas con la velocidad de la embarcación lo que se conoce como modo bottom-track (BT). En adelante este tipo de mediciones será referido como ADCP-BT. Figura 7. Instalación de ADCPs a un costado de la embarcación adosados a un brazo de acero inoxidable con los transductores a 1 m de profundidad. 16
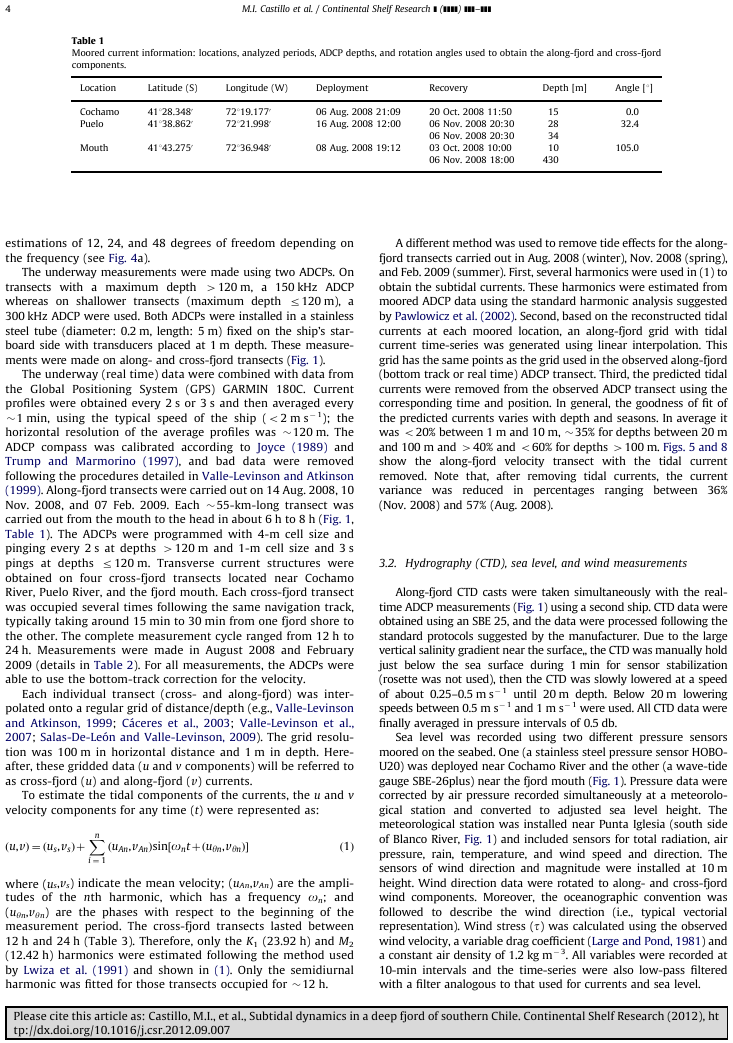
30 Los registros de corrientes en tiempo-real se efectuaron mediante el uso de dos ADCPs de 300 (en profundidades < 120 m) y de 150 khz (en profundidades 120 m) marca Teledyne RD Instruments, instalados sobre una placa, la cual se sustenta sobre un cilindro de 20 cm de diámetro y 3 m de largo. El sistema montado con los ADCPs es mostrado en la Fig. 7. Las mediciones de ADCP-BT, se efectuaron en transectos a lo largo y a lo ancho del fiordo. Los transectos a lo largo se efectuaron en los meses de Agosto y Noviembre de 2008, además de Febrero de 2009, en transectos cuya duración fue inferior a 12h. En tanto, los transectos a lo ancho se efectuaron en circuitos de menos de 25 h (detalles en Tablas 1 y 2 Cap. 3.1). Tabla 1. Tabla resumen de la información analizada en el presente estudio. 17
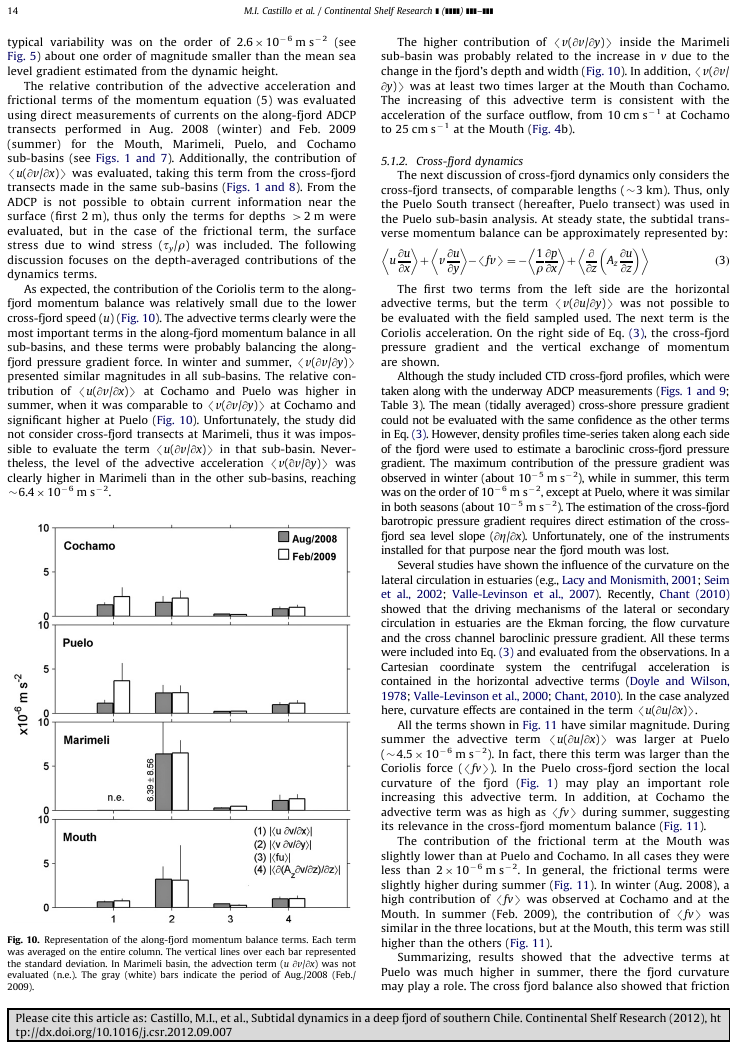
31 3.- RESULTADOS 3.1. Artículo aceptado en Cont. Shelf Res. CSR2655. doi: /j.csr Dinámica submareal en un fiordo profundo del sur de Chile Manuel I. Castillo Doctorado en Oceanografía Universidad de Concepción Resumen Este estudio presenta los resultados de un programa de mediciones sin precedentes llevado a cabo en el fiordo Reloncaví (RF), Chile. Este fiordo está localizado en torno a 41º35 S, 072º30 W, lo cual lo hace uno de los fiordos más cercanos al Ecuador del mundo. El principal objetivo de este estudio fue cuantificar la circulación media al interior del fiordo y evaluar los balances de momentum submareal a lo ancho y a lo largo del fiordo. El esfuerzo del viento a lo largo ( y ) posee un marcado cambio en la segunda semana de Septiembre de Este cambio mostró estar relacionado con el cambio estacional de invierno a primavera. En invierno, el y medio fue predominantemente fuera del fiordo, en forma similar a las corrientes medias a lo largo (v) de la capa superficial. En contraste, durante primavera y fue principalmente hacia la cabeza del fiordo en forma opuesta a las corrientes de la superficie. Cerca de la superficie (< 5 m), v y y presentaron una buena correlación en primavera. En base a observaciones, estimamos los diferentes términos de las ecuaciones de momentum. En la horizontal la fuerza del gradiente de presión fue del orden de 10-5 m s -2 en la superficie tanto a lo largo como a lo ancho del fiordo. A lo largo del fiordo los términos advectivos fueron más relevantes. En el eje a lo ancho, el término de Coriolis fue el más relevante durante invierno en la boca. Mientras que en Puelo, el término más relevante fue el advectivo en verano. La importancia de Coriolis en el balance de momentum a lo ancho sugiere que v puede estar aproximadamente en balance geostrófico. La correlación entre el perfil velocidad geostrófico y el perfil medio de v observado fue relativamente alta: R 2 > 0,79 para todas las mediciones y alcanza R 2 ~ 0,85 durante el invierno. 18
32 19
33 20
34 21
35 22
36 23
37 24
38 25

39 26
40 27
41 28
42 29
43 30
44 31
45 32
46 33
47 34
48 35
49 3.2. Artículo enviado a Estuarine, Coastal and Shelf Science. ECS-D Variabilidad estacional de la hidrografía, los flujos de sal y la mezcla en un fiordo profundo del sur de Chile. Manuel I. Castillo Doctorado en Oceanografía Universidad de Concepción Resumen Información estacional de temperatura, salinidad, oxígeno disuelto (OD) y fluorescencia junto con información meteorológica y de descarga del río es usada para describir la variabilidad estacional de las condiciones oceanográficas en el fiordo Reloncaví (RF) en el sur de Chile. El fiordo, que no posee un umbral en la boca, este bien estratificado a lo largo del año con una delgada capa superficial de agua salobre que fluye fuera del fiordo. En esta capa la salinidad cambia entre 12 3 en la superficie, a cerca de 24 en la base de la picnoclina, la profundidad de la picnoclina cambia entre 3 1 en la boca a cerca de 7 2 en la cabeza. Durante el invierno, lo vientos soplan principalmente hacia la boca reforzando el flujo de la capa superficial hacia la boca del fiordo, mientras que en primavera-verano los vientos predominantemente se dirigen hacia el interior del fiordo, en contra del flujo superficial de agua dulce, además muestran un marcado ciclo diurno. Durante el verano, las aguas en la profundidad de la picnoclina están sobre-saturadas de oxígeno (OD> 8mL L -1 ). Estas aguas sub-superficiales sobre-saturadas estuvieron relacionadas con altas concentraciones de clorofila justo debajo de la picnoclina. En primavera, altas concentraciones de OD bajo la picnoclina (entre 5 a 15 m de profundidad) estuvieron asociados a muy bajos valores de fluorescencia y aguas más cálidas, consistente con la intrusión de aguas oceánicas, superficiales y bien ventiladas al interior de RF. Bajo los 50 m, las aguas fueron relativamente más saladas (>32,6) y cálidas (>10,7ºC) en otoño e invierno 36
50 que en verano. Un comparación entre observaciones de CTD de primavera fuera del fiordo muestran que estas aguas podrían tener un origen oceánico con relativamente largos tiempos de residencia (>100 días). En contraste, el agua salobre de la capa superior posee tiempos de renovación del orden de 9(4) días durante el verano (invierno). Basado en observaciones de CTD y ADCP el número de Richardson (Ri) fue utilizado para estimar la mezcla vertical. Condiciones turbulentas (Ri<0,25) fueron observadas sólo en un 8% de los casos, valores grandes de Ri se obtuvieron bajo la picnoclina (~ 2 m). Las condiciones de estratificación dominan a lo largo de las diferentes estaciones del año en el fiordo Reloncaví. 37
51 Seasonal variability of the hydrography, salt fluxes and mixing in a deep fjord of southern Chile *Manuel I. Castillo 1,2,4, Ursula Cifuentes 2, Oscar Pizarro 2,3,4 and Leif Djurfeldt 5 1 Programa de Postgrados en Oceanografía Departamento de Oceanografía Universidad de Concepción, Chile. 2 Center for Oceanographic Research in the Eastern South Pacific (COPAS)-Sur Austral, Universidad de Concepción, Chile. 3 Departamento de Geofísica, Universidad de Concepción, Chile. 4 Laboratorio de Procesos Oceanográficos y Clima, Universidad de Concepción, Chile 5 Department of Oceanography, Earth Sciences Center, Gothenburg University, Sweden Keywords: salt balances; seasonal variability; Chilean fjords; mixing,; Richardson number; Reloncavi Fjord (*) corresponding author: manuel.castillo@udec.cl Submitted to Estuarine, Coastal and Shelf Science sep-09/
52 ABSTRACT Seasonal information of temperature, salinity, dissolved oxygen (DO) and fluorescence, along with meteorological and river discharge information, is used to describe the seasonal variability of the oceanographic conditions in the Reloncavi Fjord (RF) in southern Chile. The fjord, which lacks a sill at the mouth, it was well stratified year-round and shows a thin surface layer of brackish water flowing outward. In this layer, salinity changes from about 12±3 at the surface to about 24 at the base of the pycnocline, and the pycnocline depth changes from about 3±1 m at the mouth to about 7±2 m near the fjord head. During winter, winds blow mainly down-fjord, reinforcing the upper layer outflow, while in spring-summer winds have a predominant up-fjord direction, contrary to upper layer outflow, with a marked diurnal cycle. During summer, waters at the pycnocline depth were over-saturated with oxygen (DO > 8 ml L -1 ). These subsurface over-saturated waters were related to high concentrations of chlorophyll observed just below the pycnocline. During spring higher values of DO observed below the pycnocline (between 5 and 15 m depth) were associated with very low values of fluorescence and warmer waters, consistent with the intrusion of oceanic, well-ventilated, surface water into the RF. Below 50 m depth, waters were saltier (>32.6) and warmers (>10.7ºC) in autumn and winter than in summer. A comparison between spring CTD observations from outside the RF showed that these waters could have an oceanic origin with relatively long (> 100 d) residence times. In contrast, the brackish water of the upper layer had a typical flushing time of about 9 (4) days during summer (winter). Based on CTD and ADCP data the Richardson number (Ri) was used to estimate vertical mixing. Turbulent conditions (Ri< 0.25) were observed only in 8% of the cases, with larger values below (~ 2 m) the pycnocline. Stratification conditions dominate along the different seasons on the Reloncavi Fjord. 39
53 1. Introduction Since early 90 s the northern part of the Chilean Patagonian has been intensively used for fish and shellfish productions. Most of this production comes from salmon farms located in semi-enclosed areas that are naturally protected from winds and rough seas. Nevertheless, these semi-enclosed environments may be highly vulnerable because their limited capacity to maintain oxygen (and nutrients) concentration over (below) critical levels (e.g. Diaz, 2001; Statham, 2012). The increasing aquaculture activities in this coastal regions may have large direct and indirect impacts, which may, comprise their ecological integrity (Gillibrand and Turrell, 1997; Wilson, 2002; Stigebrandt et al., 2004; Holmer et al., 2008; Iriarte et al., 2010). Complex and scientifically based regulation frameworks are needed to preserve both, the environment and the aquaculture activity (Buschmann et al., 2009). One of the first Chilean fjord used for salmon aquaculture was the Reloncavi fjord (41.5ºS). Even though this is one of the most studied fjords in southern Chile, many questions about its natural and anthropogenic variability remain unanswered. Soto and Norambuena (2004) pointed out the concern about the impact of the aquaculture on the system. Montero et al. (2011) analyzed the seasonal variability of primary production and how it impacts different components of the pelagic food webs. Valle- Levinson (2006), based on underway measurements of currents, temperature and salinity observations, studied for first time the circulation of this fjord. Recently, Castillo et al. (accepted in Continental Shelf Research) using moored and underway ADCP data, along with meteorological and river discharge information, studied the along-fjord circulation and its forcing in the RF. They showed that the along-fjord subtidal currents have a three-layer vertical structure, with a thin (< 5 m) outflow upper layer, a thick intermediate inflow layer and a weak deep outflow layer, confirming previous results obtained by Valle-Levinson et al.(2007). At the mouth, the cross-fjord dynamic balance during winter was mainly geostrophic while in the interior of the fjord friction and advective terms were also relevant to balance the crosschannel pressure gradient. 40
54 Little is known about the necessary vertical mixing to maintain the salt balanced in the Reloncavi fjords. In general, fjord are characterized because the runoff and direct precipitation input fresh waters into the upper layer, which flow out of the fjord. Below this surface layer, seawater enters into the fjord creating the estuarine circulation cell. Vertical mixing processes, which contribute to entrain seawater into the surface layer, are key for the estuarine circulation (Griffin and LeBlond, 1990; Grubert, 1990; Monismith, 2010). To describe and quantify these mixing processes it is necessary to perform especial observations that involve very high spatial and temporal resolutions (e.g. Peters et al., 2000; Peters et al., 2001; Arneborg et al., 2004) or using numerical models (e.g. Bowden and Hamilton,1975; Chen and Sanford, 2009). Nevertheless, indirect estimations can be carried out based on traditional current, temperature and salinity measurements. The objective of the present study is to describe the seasonality of the hydrography and other forcing of the estuarine circulation in the RF and quantify the internal mixing during winter and summer. 2. Study area The Reloncavi Fjord (RF) is centered at S; W the overall length is 55 km and the averaged width is 3 km. There is a deep-sill (~ 200 m depth) located at 15 km from the mouth, this structure does not seem to be a barrier to the connection of external waters. The fjord has four sub-basins: I) mouth-marimeli, II) Marimeli-Puelo, III) Puelo-Cochamo and IV) Cochamo-Petrohue. The mean depths of each sub-basin are 440 m, 250 m, 200 m and 82 m, respectively (Fig. 1). The main freshwater input to RF is trough the Puelo River (at the center of the fjord) with an annual discharge of 650 m 3 s -1. Another important freshwater supply (annual mean of 255 m 3 s -1 ) is the Petrohue River (located at the head). Minor freshwater inputs are associated to the Cochamo River (annual mean of 20 m 3 s -1 ) (Niemeyer and Cereceda, 1984) and from the Canutillar (75.5 m 3 s -1 annual mean of the hydroelectric plant) (Fig. 1). The freshwater input due to direct precipitation over the fjord is only to around 2% of the discharge of the main rivers (León, 2005) and for the 41
55 water and salt balances of this study, its contribution was considered balanced by the evaporation. Minor sources associated to the terrestrial runoff (e.g. due to rainfall, groundwater, wastewater, etc.) are difficult to quantify and they are not considered in the salt and water balance. Winds in the region showed large seasonal variability.. North and northwest winds are predominant during autumn-winter, while south and southwest winds prevail during spring-summer (Saavedra et al., 2010). Seasonal changes of the wind pattern were associated with an abrupt austral winter-spring transition observed in the surface layer temperature in the RF (Montero et al., 2010). During winter, the alongfjord wind stress ( y ) is mainly out-fjord with intensities < 0.2 N m -2. In summer, y is directed up-fjord opposing the surface outflow with intensities ~0.1 N m -2 and maximum < 0.3 N m -2. Additionally during this season y showed a clear diurnal cycle probably related to the radiational tides effect, as has been suggested for other inland seas (Farmer and Freeland, 1983; Zaytsev et al., 2010). The y also showed a high correlation with the sea-level slope and represent one-third of their variance (Castillo et al., in press). Tides in the Reloncavi sound, outside the fjord, may reach a range of ~12 m during spring-tides (Cáceres et al., 2003; Valle-Levinson et al., 2007). Nevertheless, sea level time series collected in The Reloncavi sound, near the Reloncavi fjord mouth, (Castillo and Pizarro, unpublished data) show that this range never exceed the 7 m. Inside the RF tides also may reach a range of ~7 m during spring-tide and they are predominantly semidiurnal (F=0.11). The relationship between sea-level and barotropic current fluctuations is consistent with a standing wave (phase ~ 90º). 3. Data and Methods Except for the ADCP current time series, most data were registered in all seasons. The representative months for each season used in this study were: September to November for spring, December to February for summer, March to May for autumn 42
56 and June to August for winter. The same right-handed coordinate system was used for current and surface wind stress vectors, where the along-fjord (y-component) was positive toward the fjord head. Consequently, the cross-fjord x-component was positive toward east at the head and toward the south at the mouth. 3.1 Meteorological measurements A meteorological station was installed near the Puelo River mouth (see Fig. 1). The station included sensors for wind direction and magnitude (here wind directions are accordingly to the meteorological convention), solar radiation, rain, and air temperature. The wind magnitude and direction sensors were installed 10 m over the sea-level and were set to collect data every 10 minutes from Jun-12/2008 to Mar- 30/2011, gaps represented only the 0.04% of the data. The wind stress ( ) was calculated using a drag coefficient, which depends of the magnitude (see Large and Pond, 1981) and a constant air density of 1.2 kg m Freshwater inputs The data of the Puelo River discharge were provided by Direccion General de Aguas, Chile (DGA; The data is regularly collected in a station located 12 km up-stream of the Puelo River s mouth (Fig. 1). These data expanded from Jan-2003 to Dic-2011, here gaps represented ~ 2% of the total. Although the discharge of the Petrohue river (RPt) was not directly measured, an estimation of its runoff was obtained using data from the Puelo River (RP) discharge and a linear regression between both annual cycles. In the case of the RP the annual cycle was estimated with data between 1975 and 1981 (Niemeyer and Cereceda, 1984). The annual cycle of the RPt was based on the period (Niemeyer and Cereceda, 1984). Both annual cycles were highly correlated (R 2 = 0.88) then RPt = * RP The discharges of the Cochamo River (20 m 3 s -1 ) and from the Canutillar hydroelectric (75.5 m 3 s -1 ) were considered as constant supplies (Niemeyer and Cereceda, 1984; Sistema Interconectado Central, Chile, 43
57 3.3 Hydrographic (CTD) measurements The hydrographic sections in the RF were collected with a CTD SeaBird 25 equipped with a SeaBird 43 dissolved oxygen sensor and a Wet-Lab/Wet-Star fluorometer (ECO-AFL). The concentration of Chlorophyll-a (mg m -3 ) from Fluorescence was accordingly to the typical relation provided by the CTD manufacturer. The CTD- Oxygen/Fluorometer (CTDOF) measurements were conducted in several along- and cross-fjord transects. The periods and the number of the stations carried out during the different campaigns are shown in Table 1. The cross-fjord CTDOF measurements were made in coordination with the underway ADCP measurements. CTD casts were repeated every about 1 hour at both sides of the cross-fjord transects made at Cochamo and at the Mouth (Fig. 1b, 1c). Winter CTD casts only reached ~50 m depth, due to problems with the oceanographic winch. During those casts the CTD was not equipped with oxygen sensor. During all the other study periods the CTD was equipped with oxygen and fluorescence sensors. 3.4 Currents (ADCP) measurements The measurements of currents were made using Acoustic Doppler Currentmeter Profilers (ADCPs from RD Instruments) of different frequencies (see Table 1) in two complementary ways: self-contained (moorings) and real-time (underway). The selfcontained (SC) ADCPs were installed in two mooring systems deployed at the Mouth and Cochamo (Fig. 1). At the Mouth, two ADCPs were installed in a subsurface mooring. A 75 khz ADCP was located near the bottom (450 m depth) and a 300 khz ADCP was located at about 20 m depth. These measurements are described in Castillo et al. (in press). The other ADCP was moored near Cochamo using a surface buoy. The ADCP (600 khz WH RDI) was also looking up at 11 m depth. This mooring type of mooring allowed keeping the sensor at about the same distance from the surface during a complete tidal cycle and with a 0.5 m cells, obtaining a better resolution of the currents in the upper layer (Table 1). 44
58 The underway ADCP data was obtained using two different ADCP. One of 150 khz for bottom-depths > 120 m, and another of 300 khz for shallower regions. Both ADCPs were installed in a stainless steel tube of 5 m length and 0.2 m of diameter on the side of the ship. The transducer depth was 1 m below the surface. Data processing was described in Castillo et al. (in press) Geostrophic Velocity (v g ) estimations The v g were derived from the cross-fjord CTDOF measurements described previously. For absolute estimations of v g it is critical to determine a level of reference. Individual geostrophic profiles were used to estimate the vertical velocity gradient used for estimations of the Richardson number. In addition, absolute geostrophic velocities were obtained by fitting the v g profiles to the direct observations of velocity based on the ADCPs. 3.6 Salt flux estimations and flushing Time Assuming a steady state conditions and the existence of a balance of salt and water is possible to use a box model to estimate the flushing time (Officer, 1976; Gordon et al., 1996). This method considers two well-mixed boxes of water. The upper layer outflows from the estuary whereas the lower layer inflows. In these estimations, seasonal salinity averages for the upper and for the deep layer were used. The flushing time of the brackish water (the upper layer) was estimated following Knudsen s hydrographic relation. Flushing time estimation for the brackish water (T br ) requires the calculation of the brackish water outflow (Q br ), which involve the net freshwater input (Q fw ), plus the seawater (Q sw ) inflow. Another important estimation is the freshwater fraction represented by, fr = 1 S br /S sw, here S br /S sw is the ratio between the upper layer salinity and the salinity of the seawater in the lower layer. Additionally, the brackish 45
59 water outflow is defined as, Q br = Q fw /fr. Using the total volume of the brackish water and their flow (Q br ), the flushing time is defined by T br = V br /Q br. The salt fluxes were estimated only for winter and summer, because only in these seasons simultaneous measurements of currents and CTDOF were available (see sections ). Two different ways to obtain horizontal salt flux (Fs H ) were used in this study. The first one was based on the Knudsen relation mentioned above. Results from this relation are representative of the whole basin conditions in steady state. In the case of the entire fjord, results represent the four sub-basins (I-IV). Estimations for individual subbasins were also made, but only calculations for the head sub-basin (basin IV) are presented here. The horizontal salt flux (Fs H ) was obtained from the relation, Fs H = Q br S br. The second way used to estimate the salt fluxes is based on the local salt flux (Fs L H ). In this case, the horizontal salt flux is estimated from the divergence of the vertical salt flux Fs L H = Fs V / z, where Fs V is the vertical salt flux Fs V = z S/ z, where z is the eddy diffusivity coefficient (see section 3.7) and S/ z is the vertical gradient of salinity. The upper L indicated that this flux is locally estimated, and represent the net contribution to the horizontal flux just from the vertical divergence. Because we do not have an estimation of the net incoming flux to the control volume due to Fs H / x and Fs H / y. Assuming that at the fjord head (and at the coasts) there is no salt input, both estimations are related by Fs H = A Fs L H, where A is the total horizontal area of the fjord at a given depth. These estimations do not take into account other deep sources of salt due to the deep circulation, where different mechanisms (and time scales) to the estuarine circulation could be involve to control their renewal. At these depths the circulation could be decoupled from the estuarine dynamics. The cross-sectional net salt flux was neglected. 46
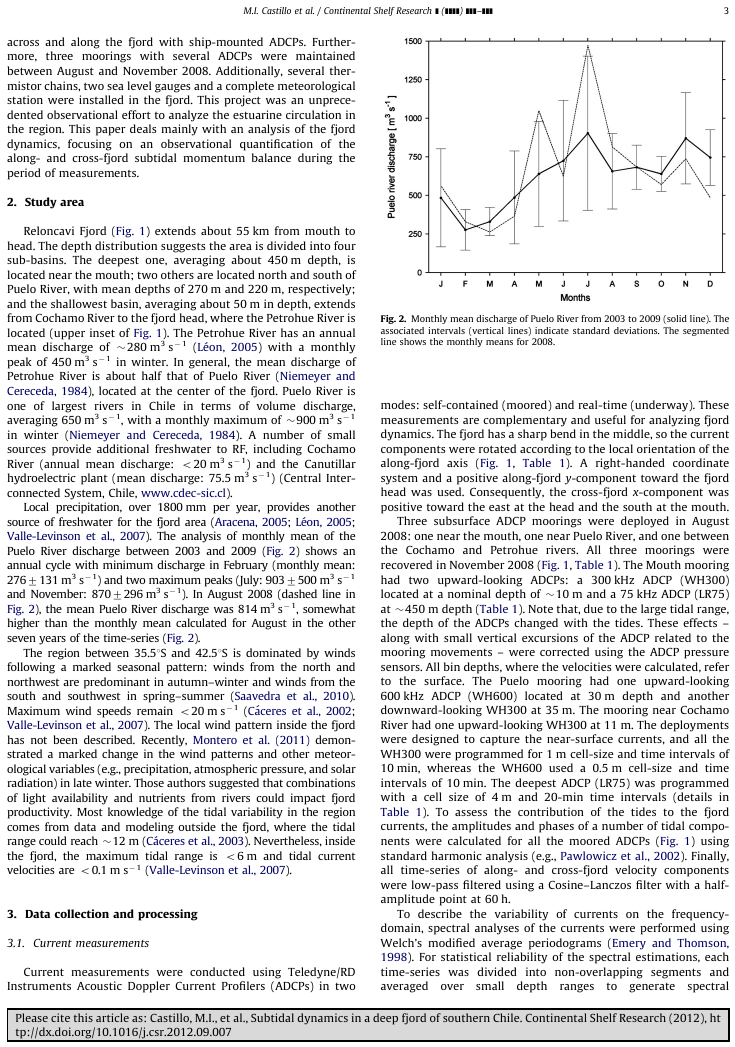
60 3.7 Estimations of the stratification and mixing To determine the halocline depth (which corresponds to the upper layer depth), we used the depth at which the maximum vertical gradient of the salinity was found. As can be expected, the pycnocline was closely related to the halocline. One simple way to characterize mixing is by using the gradient Richardson number (Ri = N 2 /( v g / z) 2 ). This number represent the competition between the stabilizing effect of the buoyancy (N 2,obtained from the CTDOF measurements) and the destabilizing effect of velocity vertical shear. Here v g / z represents the vertical shear of geostrophic velocity profiles (v g ). The observed v profiles (based on direct ADCP observations) were used to validate geostrophic velocities. The vg profiles usually reached the surface (0.5 m depth) in contrast, ADCP measurements usually were available only below 3 m depth. Using geostrophic profiles, the vertical velocity shear is probably underestimated, because non geostrophic fluctuations of the current are likely relevant. A comparison of Ri using geostrophic and observed (ADCP) currents, is included in the analysis below. To quantify the variability of the vertical mixing during winter and summer a parameterization of the eddy viscosity coefficient (A z ) was made according to Pacanowski and Philander (1981), A z = o (1+5Ri) The eddy diffusivity coefficient ( z ) is related with A z by z = A z (1+5Ri)+10-5 obtaining profiles of A z and z at the Mouth and Cochamo. 4. Results 4.1. Meteorological conditions and fresh water supply The seasonal pattern of winds were clearly observed in the direction, during spring winds predominantly were S and SE (both about ~15%) another relevant direction was SW. In summer, SE winds were predominant (27%) followed by S (23%). In this season winds were maximum (>9 m s -1 ). The SE predominance was maintained 47
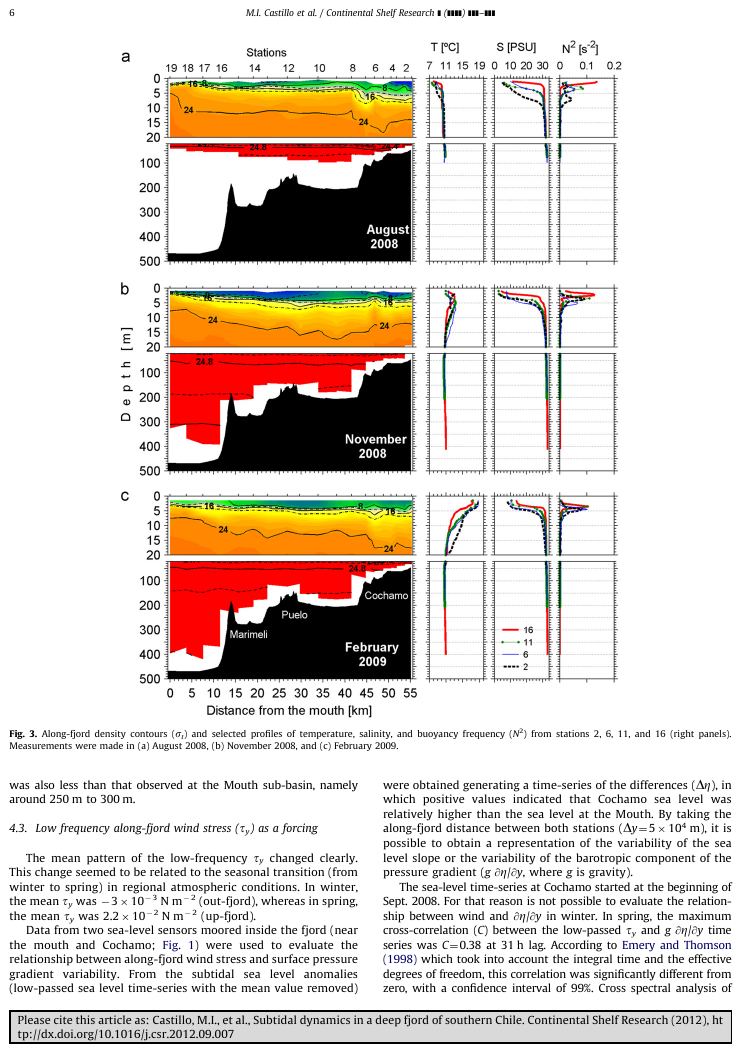
61 during autumn and S decreases until 8.4%. Also in autumn, the N explained 11.7% and intensities ~4 m s -1. These northerlies winds increase their relevance during winter reaching 21.5% (Fig. 2). The seasonal variability of the daily cycle (in local-time) of the air temperature (ºC), solar radiation (Watt m -2 ), wind stress (N m -2 ) and wind vector (m s -1 ) was also analyzed (Fig. 3). In general, all variables showed a clear pattern dominated by the seasonality. The amplitude of the all variables was minor during winter (Jun-Sep) and maxima during the spring-summer (Nov-Feb). The air temperature showed narrow range (between 6-8 ºC) compared with summer (12-18 ºC). The solar radiation, showed clearly the daylight variability (longer in summer than winter), and showed changes year round of solar radiation intensity. Similar pattern observed on air temperature and solar radiation was observed in the wind stress ( ) magnitude. In winter was nearly zero during the whole day, maximum was observed during the spring-summer period between 15 h-18 h. The wind vectors were mainly toward N and NE during spring (intensities ~ 3 m s -1 ). In summer winds were mainly toward NW and N with intensities ~ 5 m s -1 (Fig. 3). The freshwater supply or discharge in the RF showed a marked seasonal pattern with maximum supply in June (winter) where the mean discharge was 1400 ± 400 m 3 s -1, typically in this region rivers have a secondary maximum associated to the springsummer snow smelt which was observed in November (1300 ± 300 m 3 s -1 ). The lower discharges were observed during late summer (February -March) with discharges lowers than the annual mean of the Puelo River (< 650 m 3 s -1 ) Seasonal Hydrography: along-fjord CTD measurements Temperature The along-fjord temperature contours showed major seasonal changes at the upper layer (between 0 20 m depth). Below 20 m depth, slight changes were observed 48
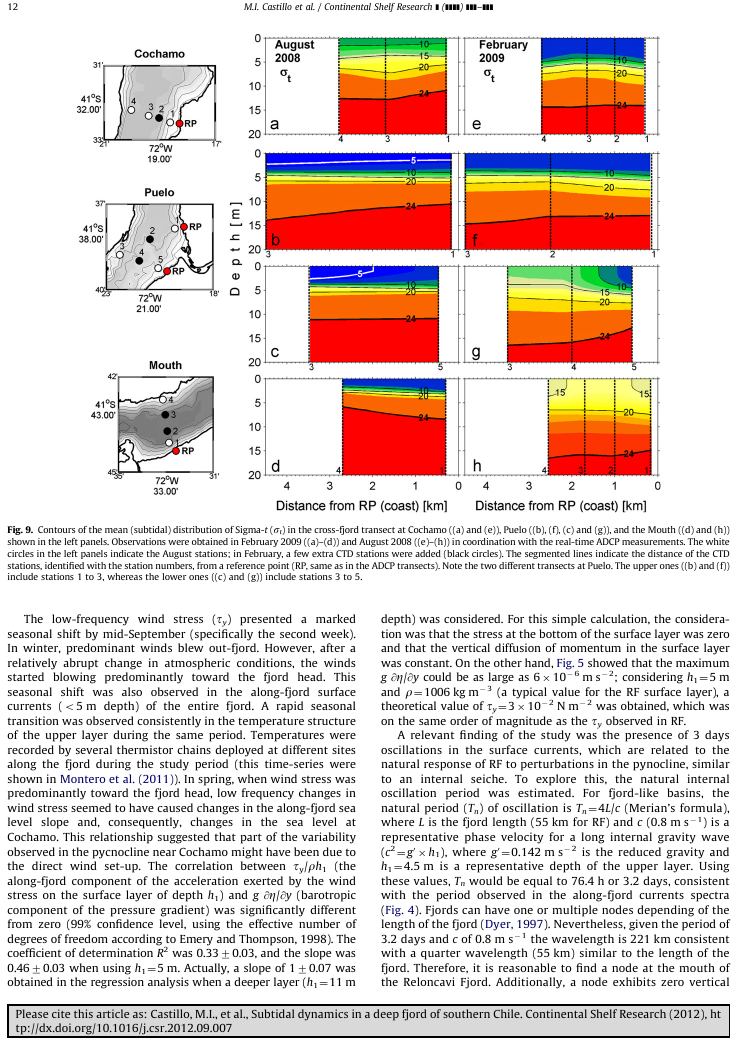
62 (10.5ºC-10.9ºC). The exception was present in autumn where relatively warmer ( ºC) waters occupied the deep basin. Near the surface, colder waters (~ 8ºC) at the Marimeli region (sub-basin II) were observed in winter (Fig. 5). In spring surface waters were warmer than winter, at depth < 20 m temperatures ranged between 11ºC (near the mouth) and 12ºC (near the head). A tongue of waters relatively warmer (>12ºC) enter to the fjord at depths centered at 7 m. This tongue was disturbed near Cochamo and reaches the surface at the station 6 (st. 6) producing a surface thermal front at the entrance of the sub-basin IV (Fig. 5). During summer, the surface waters registered temperatures > 18ºC in the entire fjord. These waters remain at depths < 5 m, the structure of temperatures below 10 m depth was similar to spring. In autumn, the upper layer (depth < 5 m) presented temperatures < 11ºC along the entire fjord, this relatively colder waters reach the bottom near the fjord s head (Fig. 5) Salinity Waters with salinities below 20 were observed at depths < 5 m during most of the seasons except in winter near of Cochamo where waters reach 7 m depth. The major changes on salinities occur below that depth. As an example, in winter the isohaline of 20 deepening from the mouth to st. 8 with a slope ~ -1 m/14 km, then changes abruptly (a slope of ~-1 m/1 km) before enter to the sub-basin IV. In the other seasons slight changes were observed in this isohaline (Fig. 5). Is noteworthy the seasonal evolution of the isohaline of 32, during winter only appear at the first 5 km from the fjord s mouth between m depth. This layer becomes more salty during spring where clearly the 32 isohaline seems to rise. The structures suggest an evolution of that isohaline during summer and finally in autumn waters below 10 m depth presented salinities >32. Similar evolution of the isohaline of 32 was observed for waters > 32, as an example the 32.6 isohaline located at a mean depth of 200 m in spring rise along the seasons until reach a mean depth of 40 m in autumn. In addition, waters associated to the bottom (salinities > 32.8) that usually 49
63 occupied depths below 250 m in the sub-basin I become salty and reach a mean depth of 120 m in autumn (Fig. 5) Chlorophyll-a /Fluorescence At depth < 2 m, the surface concentration of chlorophyll-a (Chl-a) was extremely low in winter (slightly major than 0 mg m -3 ) this slightly change along the seasons. At the sub-surface Chl-a had lower concentrations during winter and spring (< 2 mg m -3 ). Along the entire fjord, maximum Chl-a was observed during summer, where a tonguelike structure (with Chl-a >16 mg m -3 ) occupied most of depths ranged between 7 to 15 m. This structure seems to changes its depth in presence of marked changes in the bathymetry at 27 km and 45 km from the fjord s mouth. Similar structure was observed during autumn with Chl-a < 6 mg m -3 these concentrations occupied almost the entire depth range between 2-20 m along-fjord (Fig. 5) Dissolved Oxygen (DO) Minimum concentrations of Dissolved Oxygen (DO) in the entire fjord were observed during autumn, in this season DO concentrations ranged between 3-6 ml L -1, whereas during summer, higher concentrations (>10 ml L -1 ) were observed below 10 m depth into the sub-basins III and IV. Similar to the spring, during summer the 0-20 m layer increase DO upstream reaching their maxima between km from the fjord s mouth. As an example, the 6 ml L -1 contour, deepening from 5m at the mouth to 15m at Cochamo in spring, minimum changes in the depth of this contour was observed in summer but in autumn the contour maintain its depth near the surface. Waters at depths > 250 m showed DO < 3.5 ml L -1 in spring and summer, in autumn at these depths DO < 3.0 ml L -1 occupied sub-basin I. The sub-basin IV showed DO~2.5 ml L -1 at depths> 20 m in all seasons. In any case, the near bottom waters never shows suboxic or anoxic conditions (Fig. 5). 50
64 5. Discussion A particularity feature of the Reloncavi fjord is its deep-sill located at 15 km from the mouth. Usually in this type of fjords, the interior density distribution is related with the outside conditions (Pedersen, 1978). The earliest efforts to describe the Reloncavi fjord were summarized by Basten and Clement (1999) although their results consist in cruises made between 1949 and 1990 the results were not enough to make a seasonal description. The CIMAR-Fiordos (CF) project ( conducted 4 CTD stations inside of RF during campaigns CF10-12 and 18. Most of these data has been used from a biological point of view (e.g. Gonzalez et al. 2010; Montero et al., 2011; Palma et al., 2011). A physical description of the conditions inside of RF has been limited; Valle-Levinson et al. (2007) make a high-resolution study of the hydrography and currents at the Puelo region. Their major founding was the presence of a 3 layer circulation and a 2.5 h lateral oscillation in the hydrography. Castillo et al. (in press) have made another recent physical description. They used three months of ADCP currents measurements to describe the main characteristics of the subtidal circulation. They found evidences of 3 days internal seiche, a low frictional effect due to the wind stress and the existence of a complex dynamics at the Puelo River region. One of the most important findings of that study was the high correlation of the v with the geostrophic velocity approximation during summer and winter (> 75%) Seasonal variability Winds in the RF showed a marked seasonality, clearly during winter winds coming from north (out-fjord) whereas during spring winds were predominantly from south and southeast (in-fjord) similar to summer (Fig. 2). Similarly, the air temperature, solar radiation showed minimum variability during the winter (Fig. 3a, b). The wind stress and wind velocity indicated minimum variability for the period July to August, changes in wind pattern occur between April to May (autumn to winter transition) and between August to September (winter to spring transition) (Figs. 3c,d). The discharge showed a maximum in July (Fig. 4) suggesting that the estuarine circulation could be maxima 51
65 as well but unfortunately, the study has not current measurements during July to evaluate that assertion. The distribution of the along-fjord hydrography (temperature, salinity, oxygen and chlorophyll) showed a clear seasonality. In the upper layer (0-20 m depth), all variables were lower than summer, which the season when all variables reaching their maximums (Fig. 5). The deepening of the warmer water observed during spring (centered at the station 13 in Fig. 5) could be related with the input of colder waters from the Puelo river, due to the snow melt of spring. During these seasons, the discharge has its secondary seasonal peak (Fig. 4). This region located at the center of the fjord is the zone where the major input of freshwater is supply to the RF. In addition, here the RF changes its orientation and major curvature is present. The combination of all these factors contributes to the complex dynamics of this region (Valle-Levinson et al., 2007; Castillo et al., in press). For instance, Valle-Levinson et al (2007) suggest that the Puelo region is a zone where sub-pycnocline waters with low DO could reach the surface. In the observations during the four seasons into the RF, the DO was not as low as Valle-Levinson et al., (2007) where DO concentrations were < 2 ml L -1. In fact DO close to the bottom exceed 3 ml L -1 and only near of the head of the fjord DO~2.5 ml L -1 were found. Similar DO were found by Montero et al. (2011) using the Winkler method to estimate their concentrations. During summer, the along-fjord DO distribution showed higher concentrations (~ 10 ml L -1 ) at the pycnocline which also seems to be a barrier for the phytoplankton because the maximum Chl-a (> 16 ml L -1 ) occur just below the pycnocline (Fig. 5). This higher DO and Chl-a pair during summer, suggested an in situ productivity different to the case of spring where lower Chl-a and high DO was an indication of the advection of waters with high DO into the fjord. Montero et al (2011) indicated that the higher Chl-a observed during summer were produced by thecate dinoflagelates 52
66 (Dynophyceae) whereas in winter-spring the phytoplankton communities were dominated by diatoms of the genus Skeletonema. In spring and summer, the deep layer (depths > 200 m) of the sub-basin I was occupied by waters of temperatures < 10.7ºC, salinity > 32.6 and DO < 3.5 ml L -1. In autumn, the presence of waters < 3.0 ml L -1 below 300 m during summer suggested an intrusion of low oxygen waters into the fjord with salinities > 32.8 and temperatures > 11ºC. Although the study did not consider deeper DO measurements during winter, the depth ~ 60 m of the isohaline of 32.6 during this season suggest similar conditions in DO could be sustain in winter. These results suggest a pattern of circulation with saltier and relatively warmer water entering during autumn and winter to RF. This was also observed in the distribution of temperature, salinity and DO of several CTD stations made from the Guafo mouth up to RF (Palma et al., 2011). Those distributions suggest that during winter oceanic waters penetrated at depths below 50 m. This scheme of circulation was propose by Silva et al. (1998) which suggest the intrusion of ASAA waters in the fjord system around the Chiloe island, but these findings reveals a seasonal pattern of this deep circulation which is intense during autumn-winter and weaker during spring-summer. In the upper layer, the seasonal changes in the salinity could be related with the freshwater input through the salt flux. A marked seasonality in both parameters produced a seasonal variability of the horizontal and vertical salt fluxes and the flushing time of the brackish waters. The estimations of the salt fluxes were made in a two-layer box model considering: 1) the entire fjord (sub-basins I - IV), and 2) only the sub-basin IV (Cochamo-Petrohue). The upper layer considered depths between 0-20 m, separation supported by the horizontal density surfaces observed, and the approximately constant z below 20 m depth (Fig. 8) this is a first step to addressed the salt fluxes on the region. Another methodology to estimate the exchange flow is use the halocline coordinates, (McCreary et al, 2011; Chen et al., 2012), instead of the selection of a depth. This technique is not directly applicable to the data obtained 53
67 in this study, and the authors thinks that would be highly relevant when a validated numerical model will be used for the RF. The relative importance of the freshwater input could be addressed by the freshwater fraction (fr) which was higher during spring in the sub-basin IV (0.73) and for the RF basin (0.72), in the other seasons fr was almost the same for the RF basin (~0.60) and slightly higher in the sub-basin IV (between ). In the case of freshwater discharges (Q fw ) the flows in the sub-basin IV (RF basin) were comparably lower in summer with 105 m 3 s -1 (523 m 3 s -1 ) than the other season which ranged between 291 and 373 m 3 s -1 (1039 and 1293 m 3 s -1 ). Additionally, the estimation of the flushing time of the brackish water (T br ) in the sub-basin IV (RF basin), and higher T br was observed during summer reaching 4.8 days (9.4 days) than other seasons where T br was < 2.6 days (< 4.3 days) (Table 2). Calvete et al. (2011) estimated the flushing time of the surface brackish water for the Aysen fjord (Chile) their results indicated relatively short times ~3.5 days, which they attributed that influenced in the low phytoplankton biomass observed. In the case of the RF, the highest Chl-a (proxy of phytoplankton biomass) concentrations was observed during summer (>16 mg m -3 ) where the high T br was estimated (< 10 days) (Fig. 5 and Table 2). The seasonal description indicated that major contrasting in the variables occur during winter and summer, during both seasons measurements of currents were also obtained at two locations near of the fjord mouth (into the sub-basin I) and near Cochamo (into the sub-basin III) as is indicated in the Fig Stratification and mixing There are a high correlation between the v and the v g mean profiles, even down intense y (~ 0.2 N m -2 ) towards the fjord s head, this probably modified the cross-fjord pressure gradient because both (v and v g ) velocity profiles showed an opposite structure to the estuarine circulation (Fig. 6). 54
68 Although the estuarine circulation shows to be predominant, winds could eventually modify this circulation. This suggestion arises from the analysis of the mean profiles during summer when y never exceeds 0.1 N m -2. Here winds mainly were toward the fjord s head (positive) and the mean profiles of v at depths < 5 m seems to be affected by these opposite winds at the surface (Fig. 6). In contrary to the observed in other regions as the Juan de Fuca strait where the mean circulation switched between estuarine and transient events (Thomson et al., 2007) in the Reloncavi fjord the estuarine circulation is present along the seasons (Fig. 5). The relevance of the winds over the circulation seems to be limited in the brackish layer a complementary analysis between the y and v showed that higher coherences were observed associated at the daily band near over 5-7 m depth (Fig. A.1) Richardson Number estimations Taking into account all the profiles of Ri calculated from several profiles of N 2 and velocity gradients the analysis exposed on the section 3.7 provides the eddy viscosity coefficient (A z ) and the eddy diffusivity coefficient ( z ) for both locations (Mouth and Cochamo) during winter and summer (Fig. 6). The major dispersion of both coefficients were observed during summer especially at the Mouth the condition of mixing (Ri<0.25) were present in mostly of the cases were A z and z were > 10-3 (m 2 s -1 ). These mixing conditions showed that during winter only 4% were under this condition whereas in Cochamo 7.4% of the cases presented a Ri<0.25 which is a clear indication that the RF maintains its stratification condition during winter and summer. T conditions of Ri< 0.25 was present occurs around depths of ~ 4 m during winter and depth of ~ 6 m during summer. Theses depths were consistent with the location of the pycnocline at each location and indicated that when the mixing was present occur at the pycnocline depth which in all the cases were observed at depths < 10 m. The mean profiles of Ri only were <0.25 during winter at 3 m depth just over the pycnocline (Fig. 8). 55
69 Eddy diffusivity ( z ) and salt fluxes profiles High diffusivity ( z ) was present during winter in both locations (Mouth and Cochamo) and was largest ( z > 7 x 10⁻⁴ m 2 s -1 ) over 5 m depth. These maximums were related in both locations with the maximum on the vertical gradient of the velocities and the role of the buoyancy (N 2 ) was clearly minor in the structure of z, these were more evident during winter at Cochamo. During summer, z was less than 1 x 10⁻⁴ m 2 s -1 at the Mouth and maximum was observed at 7 m in Cochamo. The vertical salt fluxes (Fs v ) associated indicated that Fs v were largest in winter reaching 2.61x10⁻³ kg-sal s -1 m -2 at 3 m at the Mouth whereas Fs v reach 1.10 x10⁻³ kg-sal s -1 m -2 at 5 m in Cochamo (Fig. 8). The vertical gradient of Fs v is a proxy for the horizontal salt flux (Fs L H ) indicated consistent with the all the other variables that the maximum Fs L H was observed during winter at the Mouth here negative Fs L H indicated the output of salt from the system. During summer the Fs L H profile shows values ~ 0, indicating that during summer the salt support to the upper layer is minima at the Mouth (Fig. 8). 6. Conclusions The seasonal variability of winds in the RF it is characterized by predominantly south and southeast winds (up-fjord winds) during summer with magnitudes between 3 and 9 m s -1. In winter winds were mainly from the North (out of fjord) with magnitudes > 7 m s -1 and < 9 m s -1. Winds also showed a strong daily cycle during summer. Wind stress shows mean magnitudes > 3.5x10⁻² N m -2, whereas in summer its mean magnitude was one order of magnitude smaller than during winter. High values of DO observed near the pycnocline during summer were related to in situ production of the phytoplankton. In contrast, the relatively high values of DO observed just below the pycnocline during spring where associated with warm (and low Chl-a) water from the outer region of the RF. This water with relatively high DO 56
70 and low Chl-a was present below the pycnocline in almost the entire fjord during spring. At greater depths (> 50 m) relatively saltier (>32.6) and warmer (>10.7ºC) waters were observed during autumn and winter. These waters have oceanic characteristics and changed with seasons. The input of relatively dense water into the RF, which fill the deeper parts of the basin, was larger during autumn-winter and weaker during spring-summer. These results are also supported by DO observations. The brackish water of the upper layer during summer has flushing times of 9.4 days (4.8 days) for the entire fjord (Cochamo-Petrohue sub-basin). These times are about double the times estimated for winter. The mixing/stratification conditions during winter and summer shows a gradient Richardson number larger than 0.25 along the seasons, indicating that the Reloncavi Fjord is well stratified year-round. Only 8% of the estimated Ri were below During winter (summer) vertical and horizontal salt fluxes were maximums (minimum). Probably, larger river discharges are related to maximum salt fluxes observed during winter. 7. Acknowledgments The authors thank Captain Julio Gutierrez and the crew of the Estrella Polar. Several M.S. students from the University of Gothenburg, Sweden, and undergraduate and graduate students from the University of Concepción, Chile, collaborated in the fieldwork. This study is part of the COPAS-Sur Austral program (PFB RP1 headed by OP) and was co-supported by a FIP project headed by Dr. Paulina Montero. MC was supported by a CONICYT scholarship (D ) and a thesis support scholarship (AT ). 57
71 8. References Arneborg, L., Janzen, C., Liljebladh, B., Rippeth, T.P., Simpson, J.H., Stigebrandt, A., Spatial Variability of Diapycnal Mixing and Turbulent Dissipation Rates in a Stagnant Fjord Basin. Journal of Physical Oceanography 34, Bowden, K.H., Hamilton, P., Some experiments with a numerical model of circulation and mixing in a tidal estuary. Estuarine, Coastal and Shelf Science 3, Buschmann, A.H., Riquelme, V.A., Hernandez-Gonzalez, M.C., Varela, D., Jimenez, J.E., Henriquez, L.A., Vergara, P.A., Guinez, R., Filun, L., A review of the impacts of salmonid farming on marine coastal ecosystems in the southeast Pacific. ICES Journal of Marine Science 63, Buschmann, A.H., Cabello, F., Young, K., Carvajal, J., Varela, D.A., Henriquez, L., Salmon aquaculture and coastal ecosystem health in Chile: Analysis of regulations, environmental impacts and bioremediation systems. Ocean & Coastal Management 52, Cáceres, M., Valle-Levinson, A., Atkinson, L., Observations of cross-channel structure of flow in an energetic tidal channel. Journal of Geophysical Research 108: C4, doi: /2001jc Calvete, C., Sobarzo, M., Quantification of the surface brackish water layer and frontal zones in southern Chilean fjords between Boca del Guafo (43 30'S) and Estero Elefantes (46 30'S). Continental Shelf Research 31, Castillo, M., Pizarro, O., Cifuentes, U., Ramirez, N., Djurfeldt, L., in press. Subtidal dynamics in a deep fjord of southern Chile. Continental Shelf Research. Chen, S-N, L. P. Sanford Lateral circulation driven by boundary mixing and the associated transport of sediments in idealized partially mixed estuaries, Continental Shelf Research, 29 (1): Chen, S.-N., Geyer, W.R., Ralston, D.K., Lerczak, J.A., Estuarine Exchange Flow Quantified with Isohaline Coordinates: Contrasting Long and Short Estuaries. Journal of Physical Oceanography 42, Farmer, D.M., Freeland, H.J., The physical oceanography of Fjords. Progress in Oceanography 12, Gillibrand, P.A., Turrell, W.R., The use of simple models in the regulation of the impact of fish farms on water quality in Scottish sea lochs. Aquaculture 159,
72 Griffin, D.A., LeBlond, P.H., Estuary-ocean exchange controlled by spring-neap tidal mixing. Estuarine, Coastal and Shelf Science 30, Grubert, J.P., Interfacial Mixing in Estuaries and Fjords. Journal of Hydraulic Engineering 116, Holmer, M., Hansen, P.K., Karakassis, I., Borg, J.A., Schembri, P.J., Monitoring of Environmental Impacts of Marine Aquaculture, Aquaculture in the Ecosystem, Iriarte, J., González, H., Nahuelhual, L., Patagonian Fjord Ecosystems in Southern Chile as a Highly Vulnerable Region: Problems and Needs. AMBIO: A Journal of the Human Environment. 39, León, J., Influencia del caudal del río Puelo, sobre la salinidad y la concentración de oxígeno disuelto en el estuario Reloncaví, Llanquihue, Chile, Facultad de Ciencias. Universidad Austral de Chile, Valdivia 80 pp. MacCready, P., Calculating Estuarine Exchange Flow Using Isohaline Coordinates*. Journal of Physical Oceanography 41, Monismith, S.G., Mixing in estuaries, In: Valle-Levinson, A. (Ed.), Contemporay issues in estuarine physics. Cambridge University Press, New York, pp Montero, P., Daneri, G., González, H.E., Iriarte, J.L., Tapia, F.J., Lizárraga, L., Sanchez, N., Pizarro, O., Seasonal variability of primary production in a fjord ecosystem of the Chilean Patagonia: Implications for the transfer of carbon within pelagic food webs. Continental Shelf Research 31, Niemeyer, H., Cereceda, P., Hidrografía, Geografía de Chile. Instituto Geográfico Militar, Santiago, Chile, 313 pp. Pantoja, S., Luis Iriarte, J., Daneri, G., Oceanography of the Chilean Patagonia. Continental Shelf Research 31, Pacanowski, R.C., Philander, S.G.H., Parameterization of vertical mixing in numerical models of the tropical oceans. Journal of Physical Oceanography 11, Palma, S., Silva, N., Cristina Retamal, M., Castro, L., Seasonal and vertical distributional patterns of siphonophores and medusae in the Chiloé Interior Sea, Chile. Continental Shelf Research 31, Peters, H., Bokhorst, R., Microstructure Observations of Turbulent Mixing in a Partially Mixed Estuary. Part I: Dissipation Rate. Journal of Physical Oceanography 30,
73 Peters, H., Bokhorst, R., Microstructure Observations of Turbulent Mixing in a Partially Mixed Estuary. Part II: Salt Flux and Stress. Journal of Physical Oceanography 31, Saavedra, N., Müller, E., Fopiano, A., On the climatology of surface wind direction frequencies for the central Chilean coast. Australian Meterological and Oceanographic Journal 60, Silva, N., Calvete, C., Sievers, H., Características oceanográficas físicas y químicas de canales australes chilenos entre Puerto Montt y laguna San Rafael. Ciencia y Tecnología del Mar 20, Smith, H., Haig, A.J.N., The Development of a Control Policy for Fish Farming. Water and Environment Journal 5, Statham, P.J., Nutrients in estuaries An overview and the potential impacts of climate change. Science of The Total Environment 434, Stigebrandt, A., Aure, J., Ervik, A., Hansen, P.K., Regulating the local environmental impact of intensive marine fish farming: III. A model for estimation of the holding capacity in the Modelling-Ongrowing fish farm-monitoring system. Aquaculture 234, Soto, D., Norambuena, F., Evaluation of salmon farming effects on marine systems in the inner seas of southern Chile: A large-scale mensurative experiment. Journal of Applied Ichthyology 20, Underwood, G.J.C., Kromkamp, J., Primary Production by Phytoplankton and Microphytobenthos in Estuaries, In: Nedwell, D.B., Raffaelli, D.G. (Eds.), Advances in Ecological Research. Academic Press, pp Valle-Levinson, A., Blanco, J.L., Observations of wind influence on exchange flows in a strait of the Chilean Inland Sea. Journal of Marine Research 62, Valle-Levinson, A., Blanco, J.L., Frangópulos, M., Hydrography and frontogenesis in a glacial fjord off the strait of Magellan. Ocean Dynamics 56, Valle-Levinson, A., Sarkar, N., Sanay, R., Soto, D., León, J., Spatial structure of hydrography and flow in a chilean fjord, Estuario Reloncaví. Estuaries and Coasts 30(1), Wilson, J.G., Productivity, Fisheries and Aquaculture in Temperate Estuaries. Estuarine, Coastal and Shelf Science 55, Zaytsev, O., Rabinovich, A.B., Thomson, R.E., Silverberg, N., Intense diurnal surface currents in the Bay of La Paz, Mexico. Continental Shelf Research 30,
74 Table 1. Table informative of the data sets used the study, number of profiles of CTD and the ADCPs modes: bottom-track (BT) and self-contained (SC) and their frequencies in khz and the depths of each instrument. 61
75 Table 2. Seasonal variation of the salinities (Sbr, Sw), freshwater fraction, flushing time of freshwater for each season over the entire fjord, based on the seasonal hydrographic (for box model). Sub-basins IV S br S w fr Q fw Q br Q sw V br T br Winter Spring Summer Autumn I IV S br S w fr Q fw Q br Q sw V br T br Winter Spring Summer Autumn
 mode.")
76 Figure 1: The Reloncavi fjord region in a) the upper insert showed the general region, then we shows the locations of CTD and weather stations. The legend ADCP1 and ADCP2 indicated the location of the ADCP moorings whereas BT ADCP indicated transect of ADCP in bottomtrack (BT) mode. The right insert are zoom of Cochamo (b) and Mouth (c) regions indicated in a). The lower insert d) shows the along-fjord bathymetry, here with segmented lines indicate the sub-basins limits: Mouth-Marimeli (I), Marimeli-Puelo (II), Puelo-Cochamo (III) and Cochamo-Petrohue (IV), the last black line indicated the sub-basin limits used for the flushing times estimations. The diamonds represent the location of the ADCP mooring systems showed in b) and c). 63
77 Figure 2: Seasonal variability of the wind vector in the Reloncavi fjord during the period june 2008 to march The wind-rose represent the frequency of direction and magnitude in every season which were a) spring, b) summer, c) autumn and d) winter. 64
78 Figure 3: Seasonal variability of the daily cycle of the meteorological variables: a) air temperature, b) solar radiation, c) wind stress magnitude ( ) and d) wind velocity (meteorological convention). The y-axis is the local hour to be consistent with the day-light hours. 65

79 Figure 4: Seasonal cycle of the freshwater input to the Reloncavi fjord, input due to direct precipitation was disregard. Here we also consider the freshwater supplies of the Canutillar hydroelectric (75.5 m 3 s -1 ) and the Cochamo river (20 m 3 s -1 ) as constant flows. 66
, spring/2008 (second column), summer/2008(third column) and autumn/2009 (fourth")
80 Figure 5: Along-fjord seasonal distribution of: Temperature, Salinity, Dissolved Oxygen (DO) and Chlorophyll (derived from Fluorescence). From left-to-right, each column of the inserts represents the distribution obtained during: winter/2008 (first column), spring/2008 (second column), summer/2008(third column) and autumn/2009 (fourth column). We not have DO measurements during winter also the profiles were for depth < 50 m. The blue line inserted in the DO and Chl-a distributions represent the pynocline along-fjord depth, and the number I, II, III and IV indicated the sub-basins indicated in the Fig
81 Figure 6: Geostrophic and observed mean velocity profiles in the Mouth and Cochamo during Winter/2008 (left inserts) and during Summer/2009 (right inserts). The upper inserts shows time series of the along-fjord wind stress (red line) and the near-to-surface along-fjord currents (V), the shading indicated the period where the mean profiles were estimated. 68
82 Figure 7: Seasonal relation between the vertical eddy viscosity (A z ) and eddy diffusivity ( z ) coefficients for the Mouth (black dots) and Cochamo (red dots), dots with circles indicated pairs (A z, z ) where Richardson number (Ri) is < 0.25 indicating a mixing condition. The asterisk (*) indicated the fixed pair (A z, z ) used by Castillo et al. (2012) in the same area. 69
83 Figure 8: Mixing and salt fluxes during winter (black line) and summer (blue line) at the Mouth and for winter (dashed red line) and summer (dashed green line) at Cochamo. The upper inserts shows the buoyancy frequency (N 2 ), velocity vertical gradient ( v 2 / z 2 ) and the Richardson number (Ri), whereas the lower inserts shows the eddy diffusivity coefficient ( z ), the vertical salt flux (Fs V ) and the vertical gradient of Fs V which is a proxy of the local horizontal salt flux (Fs L H ). 70

84 Figure A.1. The upper-left insert presents the rotary spectrum of the wind stress. Here, the red line indicates clockwise rotations (CW) and the black line counter-clockwise (CCW) rotations. The bar indicates the 95% confidence interval. The coherence and phase spectra between y and V for the first 10 m are present in contour plots. In the coherence, black lines indicate coherences over 80% (thin) and 99% (wide) confidence levels. In the phase spectra, only phases with coherences over 80% confidence levels were plotted (the thin black line coming from the coherence spectra). To emphasize changes in the phase, we included the 0º contour (wide black line) in the phase spectra. The mean profile of v and the mean y were included in the right inserts. Segmented vertical lines indicate the three-day, one-day, inertial (f), and 12- hour periods. 71
DISTRIBUCIÓN DE TEMPERATURA, SALINIDAD, OXÍGENO DISUELTO Y NUTRIENTES ENTRE LA BOCA DEL GUAFO Y EL CANAL PULLUCHE. (CRUCERO CIMAR 8 FIORDOS)
") DISTRIBUCIÓN DE TEMPERATURA, SALINIDAD, OXÍGENO DISUELTO Y NUTRIENTES ENTRE LA BOCA DEL GUAFO Y EL CANAL PULLUCHE. (CRUCERO CIMAR 8 FIORDOS) Alexander Valdenegro M & Nelson Silva S. Escuela de Ciencias
DISTRIBUCIÓN DE TEMPERATURA, SALINIDAD, OXÍGENO DISUELTO Y NUTRIENTES ENTRE LA BOCA DEL GUAFO Y EL CANAL PULLUCHE. (CRUCERO CIMAR 8 FIORDOS) Alexander Valdenegro M & Nelson Silva S. Escuela de Ciencias
Oceanografía en la zona sur austral de Chile: Herramientas de apoyo a la gestión de la acuicultura
 Oceanografía en la zona sur austral de Chile: Herramientas de apoyo a la gestión de la acuicultura Departamento de Medioambiente División de Investigación en Acuicultura Instituto de Fomento Pesquero Convenios
DE CORRIENTES, TEMPERATURA Y SALINIDAD EN EL ÁREA DE FIORDOS DEL SUR DE CHILE (CANALES DARWIN, NINUALAC Y MEMORY), DURANTE INVIERNO Y PRIMAVERA DEL
, DURANTE INVIERNO Y PRIMAVERA DEL") Crucero CIMAR 8 Fiordos PATRONES DE CORRIENTES, TEMPERATURA Y SALINIDAD EN EL ÁREA DE FIORDOS DEL SUR DE CHILE (CANALES DARWIN, NINUALAC Y MEMORY), DURANTE INVIERNO Y PRIMAVERA DEL 2002 Mónica Bello 1,
Crucero CIMAR 8 Fiordos PATRONES DE CORRIENTES, TEMPERATURA Y SALINIDAD EN EL ÁREA DE FIORDOS DEL SUR DE CHILE (CANALES DARWIN, NINUALAC Y MEMORY), DURANTE INVIERNO Y PRIMAVERA DEL 2002 Mónica Bello 1,
VARIABILIDAD LONGITUDINAL DEL FLUJO EN CANALES CON INFLUENCIA BATIMÉTRICA Y TOPOGRÁFICA
 Crucero CIMAR 8 Fiordos VARIABILIDAD LONGITUDINAL DEL FLUJO EN CANALES CON INFLUENCIA BATIMÉTRICA Y TOPOGRÁFICA Mario Cáceres 1, Arnoldo Valle-Levinson 2, Juan Fierro 1, Mónica Bello 1 & Manuel Castillo
2.2 CORRIENTE DE MAREA EN EL PASO DESERTORES (42º 45 S, 72º 45 W), DURANTE EL PERÍODO DE INVIERNO-PRIMAVERA DE 2004 (CONA-C10F 04-21)
, DURANTE EL PERÍODO DE INVIERNO-PRIMAVERA DE 2004 (CONA-C10F 04-21)") 2.2 CORRIENTE DE MAREA EN EL PASO DESERTORES (42º 45 S, 72º 45 W), DURANTE EL PERÍODO DE INVIERNO-PRIMAVERA DE 2004 (CONA-C10F 04-21) Sergio Salinas 1 * & Manuel Castillo 2 1 Pontificia Universidad Católica
2.2 CORRIENTE DE MAREA EN EL PASO DESERTORES (42º 45 S, 72º 45 W), DURANTE EL PERÍODO DE INVIERNO-PRIMAVERA DE 2004 (CONA-C10F 04-21) Sergio Salinas 1 * & Manuel Castillo 2 1 Pontificia Universidad Católica
UNIVERSIDAD DE MAGALLANES FACULTAD DE CIENCIAS DEPARTAMENTO CIENCIAS Y RECURSOS NATURALES
 UNIVERSIDAD DE MAGALLANES FACULTAD DE CIENCIAS DEPARTAMENTO CIENCIAS Y RECURSOS NATURALES TENDENCIAS EN LA VARIABILIDAD DE LA DISTRIBUCIÓN Y CONCENTRACIÓN DE LA CLOROFILA a EN EL ÁREA DEL ESTRECHO DE GERLACHE,
3.1 DISTRIBUCIÓN DE TEMPERATURA, SALINIDAD, OXÍGENO DISUELTO Y NUTRIENTES ENTRE PUERTO MONTT Y BOCA DEL GUAFO
 3.1 DISTRIBUCIÓN DE TEMPERATURA, SALINIDAD, OXÍGENO DISUELTO Y NUTRIENTES ENTRE PUERTO MONTT Y BOCA DEL GUAFO (CONA-C1F 4-) Cristina Carrasco M. & Nelson Silva S *. Pontificia Universidad Católica de Valparaíso
Modos de Circulación Regional
 Osorno, Chile 26 y el 30 de Mayo 2014 Modos de Circulación Regional en un Océano Turbulento Oscar Pizarro Departamento de Geofísica Instituto Milenio de Oceanografía & COPAS-Sur S Austral Universidad de
2.2 DISTRIBUCIÓN DE TEMPERATURA, SALINIDAD, OXÍGENO DISUELTO Y NUTRIENTES ENTRE PUERTO MONTT Y BOCA DEL GUAFO (CONA-C11F 05-18)
") 2.2 DISTRIBUCIÓN DE TEMPERATURA, SALINIDAD, OXÍGENO DISUELTO Y NUTRIENTES ENTRE PUERTO MONTT Y BOCA DEL GUAFO (CONA-C11F 5-18) Cristina Carrasco M. & Nelson Silva S *. Pontificia Universidad Católica de
2.2 DISTRIBUCIÓN DE TEMPERATURA, SALINIDAD, OXÍGENO DISUELTO Y NUTRIENTES ENTRE PUERTO MONTT Y BOCA DEL GUAFO (CONA-C11F 5-18) Cristina Carrasco M. & Nelson Silva S *. Pontificia Universidad Católica de
XXXIV CONGRESO DE CIENCIAS DEL MAR OSORNO, 26 AL 30 DE MAYO DEL 2014 UNIVERSIDAD DE LOS LAGOS SOCIEDAD CHILENA DE CIENCIAS DEL MAR
 C. Salas 1,, S. Núñez 1, A. Sepúlveda 1, S. Vásquez 1 & E. Tarifeño 2. 1 Instituto de Investigación Pesquera 2 Departamento de Zoología, UdeC Proyecto de Inserción de Capital Humano Avanzado en el Sector
Capítulo 3. Descripción del área geográfica donde se desarrolla el proyecto. 3.1 Descripción de las estaciónes CaTS, ADCP1 e InWaPE
 Capítulo Descripción del área geográfica donde se desarrolla el proyecto.1 Descripción de las estaciónes CaTS, ADCP1 e InWaPE Este trabajo se fundamenta en datos recolectados en aguas oceánicas al suroeste
Taller de Resultados Preliminares Crucero CIMAR 19 Fiordos
 Taller de Resultados Preliminares Crucero 27 y 28 de noviembre de 2014, a las 09:00 hrs. Auditorio de la Central Odontológica de la Armada, General del Canto N 464, Playa Ancha. Valparaíso. Jueves 27 de
2.1 DISTRIBUCIÓN DE TEMPERATURA, SALINIDAD, OXÍGENO DISUELTO Y NUTRIENTES ENTRE LA BOCA DEL GUAFO Y EL FIORDO AYSÉN
 . DSTRBUCÓN DE TEMPERATURA, SALNDAD, OXÍGENO DSUELTO Y NUTRENTES ENTRE LA BOCA DEL GUAFO Y EL FORDO AYSÉN Danitza Guerra & Nelson Silva. Escuela de Ciencias del Mar, Pontificia Universidad Católica de
Programa de Glaciología Dirección General de Aguas. Jorge Huenante G. Unidad de Glaciología y Nieves 04 de Septiembre de 2015
 Programa de Glaciología Dirección General de Aguas Jorge Huenante G. Unidad de Glaciología y Nieves 04 de Septiembre de 2015 1 I. Antecedentes Generales Distribución Global de Glaciares En Sudamérica,
Ecología de Lagunas Costeras y Estuarios 1. Definición, origen y clasificación de los estuarios. Laguna Szczecin, Polonia
 Ecología de Lagunas Costeras y Estuarios 1. Definición, origen y clasificación de los estuarios. Laguna Szczecin, Polonia Definición de estuario vs. los estuarios reales. Aestus = calor, hervir, marea
2.2 DISTRIBUCIÓN DE TEMPERATURA, SALINIDAD, OXÍGENO DISUELTO Y NUTRIENTES ENTRE PUERTO MONTT Y BOCA DEL GUAFO (CIMAR 12 FIORDOS)
") . DISTRIBUCIÓN DE TEMPERATURA, SALINIDAD, OXÍGENO DISUELTO Y NUTRIENTES ENTRE PUERTO MONTT Y BOCA DEL GUAFO (CIMAR FIORDOS) (CONA-CF -) Cristina Carrasco M. & Nelson Silva S. Pontificia Universidad Católica
. DISTRIBUCIÓN DE TEMPERATURA, SALINIDAD, OXÍGENO DISUELTO Y NUTRIENTES ENTRE PUERTO MONTT Y BOCA DEL GUAFO (CIMAR FIORDOS) (CONA-CF -) Cristina Carrasco M. & Nelson Silva S. Pontificia Universidad Católica
2.3 TIEMPO DE RESIDENCIA Y PROCESO DE MEZCLA EN LA CUENCA AL SUR DE LA CONSTRICCIÓN DE MENINEA
 2.3 TIMPO D RIDCIA Y PROCO D MZCLA LA CUCA AL UR D LA COTRICCIÓ D MIA ergio alinas 1, Juan J. Fierro 2, Manuel Castillo 2 y Jaime Letelier 1 1 scuela de Ciencias del Mar. Universidad Católica de Valparaíso
Expansión de las FAN en el Sur de Chile. Evidencias y Desafíos
 Facultad de Ciencias del Mar y de Recursos Naturales - FACIMAR Expansión de las FAN en el Sur de Chile. Evidencias y Desafíos Dr. Italo Masotti 23 de Agosto de 2017 Puerto Varas COSTAR Centro de Observación
Instituto Geofísico del Perú - IGP
 Instituto Geofísico del Perú - IGP Programa Presupuestal por Resultados Nº 068: Reducción de vulnerabilidad y atención de emergencias por desastres Producto: Entidades informadas en forma permanente y
2.1 VORTICIDAD Y MAREAS INTERNAS EN DOS ZONAS DE INTERCAMBIO EN EL GOLFO DE ANCUD (CONA-C10F 04-05)
") 2.1 VORTICIDAD Y MAREAS INTERNAS EN DOS ZONAS DE INTERCAMBIO EN EL GOLFO DE ANCUD (CONA-C10F 04-05) Mario Cáceres 1*, Arnoldo Valle-Levinson 2, Mónica Bello 1, Juan P. Belmar 1 & Manuel Castillo 1 1 Servicio
2.1 VORTICIDAD Y MAREAS INTERNAS EN DOS ZONAS DE INTERCAMBIO EN EL GOLFO DE ANCUD (CONA-C10F 04-05) Mario Cáceres 1*, Arnoldo Valle-Levinson 2, Mónica Bello 1, Juan P. Belmar 1 & Manuel Castillo 1 1 Servicio
ESTIMACIÓN DE PRODUCCIÓN PRIMARIA DEL FITOPLANCTON DE BAHIA MAGDALENA BCS, MÉXICO (FASE II).
.") ESTIMACIÓN DE PRODUCCIÓN PRIMARIA DEL FITOPLANCTON DE BAHIA MAGDALENA BCS, MÉXICO (FASE II). Resumen.- En el periodo de febrero a diciembre del 7 se realizaron seis muestreos en catorce estaciones de Bahía
ESTIMACIÓN DE PRODUCCIÓN PRIMARIA DEL FITOPLANCTON DE BAHIA MAGDALENA BCS, MÉXICO (FASE II). Resumen.- En el periodo de febrero a diciembre del 7 se realizaron seis muestreos en catorce estaciones de Bahía
VARIABILIDAD ESPACIAL Y TEMPORAL DE LA TEMPERATURA, SALINIDAD Y DENSIDAD EN EL FIORDO AYSÉN, CHILE
 Volumen 8 Nº 2 (Abril-Junio, 2017), pp. 21-36. VARIABILIDAD ESPACIAL Y TEMPORAL DE LA TEMPERATURA, SALINIDAD Y DENSIDAD EN EL FIORDO AYSÉN, CHILE SPATIAL AND TEMPORAL VARIABILITY OF TEMPERATURE, SALINITY
Grupo de Trabajo I. Grupo de Trabajo I
 Observaciones directas del reciente cambio del clima: Algunos aspectos del clima en los que no se han observado cambios: Tornados Tormentas de polvo Granizo Rayos Hielo marino Antártico Observaciones paleoclimáticas:
Detección y seguimiento de remolinos de mesoescala en el Pacífico Sur-Oriental usando un
 Detección y seguimiento de remolinos de mesoescala en el Pacífico Sur-Oriental usando un método geométrico Osvaldo Artal Arrieta Tutor: Ali Belmadani Trabajo Final de Tópicos en Física VI Departamento
Ciencia y Tecnología del Mar ISSN: Comité Oceanográfico Nacional Chile
 Ciencia y Tecnología del Mar ISSN: 0716-2006 cona@shoa.cl Comité Oceanográfico Nacional Chile Castillo, Manuel; Bello, Mónica; Reyes, Hernán; Guerrero, Yenny Patrones de corrientes y distribución vertical
Vulnerabilidad por vertido. Un tema de trayectorias
 Vulnerabilidad por vertido. Un tema de trayectorias Dr. Manuel Espino Jefe del área de Oceanografía Costera Laboratorio de Ingeniería Marítima Vertidos desde embarcaciones Vertidos desde tierra Vertidos
5.4 VARIACIONES EN LA DISTRIBUCIÓN VERTICAL DEL MEROPLANCTON E ICTIOPLANCTON EN LA ZONA DE AGUAS INTERIORES DE LA X REGIÓN (CONA-C10F 04-06)
") 5.4 VARIACIONES EN LA DISTRIBUCIÓN VERTICAL DEL MEROPLANCTON E ICTIOPLANCTON EN LA ZONA DE AGUAS INTERIORES DE LA X REGIÓN (CONA-C10F 04-06) Leonardo Castro *, Roxana León & Mauricio Landaeta Universidad
5.4 VARIACIONES EN LA DISTRIBUCIÓN VERTICAL DEL MEROPLANCTON E ICTIOPLANCTON EN LA ZONA DE AGUAS INTERIORES DE LA X REGIÓN (CONA-C10F 04-06) Leonardo Castro *, Roxana León & Mauricio Landaeta Universidad
Inventario y Monitoreo de Glaciares
 Inventario y Monitoreo de Glaciares (unidad de Glaciología y nieves DGA-MOP) Alexis Segovia Rocha Geógrafo. Magíster(c) Áreas Silvestres y Conservación de la Naturaleza Temario Importancia de los glaciares.
Palabras claves: Climatología; humedad específica; vapor de agua disponible.
 RESUMEN VARIACION ANUAL DEL VAPOR DE AGUA SOBRE ARGENTINA Adriana E. Fernández Departamento de Ciencias de la Atmósfera--Universidad de Buenos Aires Buenos Aires, Argentina El objetivo de este trabajo
FICHA TÉCNICA PARA PRESENTAR TRABAJOS
 1.- NOMBRE DEL PROYECTO DE INVESTIGACIÓN O DESARROLLO TECNOLÓGICO. Forzamientos meteorológicos y oceanográficos que gobiernan las descargas submarinas (DAS) del acuífero en Yucatán 2.- OBJETIVO Y DESCRIPCIÓN
2.- ASPECTOS GENERALES DEL REGIMEN DE VIENTO EN CHILE
 2.- ASPECTOS GENERALES DEL REGIMEN DE VIENTO EN CHILE El uso de la energía eólica está restringido a la capa atmosférica más cercana al suelo, donde el flujo del aire se encuentra fuertemente condicionado
Ciencia y Tecnología del Mar ISSN: Comité Oceanográfico Nacional Chile
 Ciencia y Tecnología del Mar ISSN: 0716-2006 cona@shoa.cl Comité Oceanográfico Nacional Chile SILVA, NELSON; VALDENEGRO, ALEXANDER CARACTERIZACIÓN OCEANOGRÁFICA DE CANALES AUSTRALES CHILENOS ENTRE LA BOCA
La navegación marítima es hoy en día uno de
 Revista de Marina Nº 959, pp. 71-75 ISSN 0034-8511 CARACTERIZACIÓN DE LA MAREA EN EL CANAL KIRKE Resumen Matías Ignacio Sifón Andalaft* Se presenta un análisis detallado de las variables que influyen en
El régimen de viento costero en escenarios de cambio climático global
 El régimen de viento costero en escenarios de cambio climático global René D. Garreaud Department of Geophysics Universidad de Chile www.dgf.uchile.cl/rene Seminario CONA-UNAB, 27 Agosto 2009 Programa
PROFESORADO DE UNIVERSIDADES Y CENTROS DE INVESTIGACIÓN
 PROFESORADO DE UNIVERSIDADES Y CENTROS DE INVESTIGACIÓN DATOS DE IDENTIFICACIÓN Y CONTACTO APELLIDOS: Vázquez López-Escobar NOMBRE: Águeda DIRECCIÓN POSTAL: Av. De la Universidad de Cádiz, nº 10, 11519-Puerto
5.1.2 Evolución del Albedo Modelación del Snow Water Equivalent Intercambio de energía en el manto de nieve
 TABLA DE CONTENIDO 1 Introducción... 1 1.1 Objetivos... 2 1.1.1 Objetivo General... 2 1.1.2 Objetivos específicos... 2 1.2 Organización del informe... 3 2 Revisión Bibliográfica... 4 2.1 Hidrología de
Unidad I: Zonas y Paisajes de Chile.
 PPT: N 1 Lunes 07 de marzo de 2016 Unidad I: Zonas y Paisajes de Chile. Objetivo de la sesión: Caracterizar a Chile Tricontinental, las unidades de relieve de Chile, las Zonas Naturales. Qué sabemos de
INFORME TECNICO INFORMACION HISTORICA OCEANOGRAFICA DEL PACIFICO COLOMBIANO
 INFORME TECNICO INFORMACION HISTORICA OCEANOGRAFICA DEL PACIFICO COLOMBIANO Cabrera (1992), realizó un estudio del comportamiento de la capa de mezcla para un área del Pacífico colombiano, comparando esta
BOLETÍN OCEÁNICO-ATMOSFERICO
 DIRECCION GENERAL DE INVESTIGACION PESQUERA DEL PACIFICO NORTE BOLETIN OCEANICO- ATMOSFERICO VOLUMEN 1 No. 3 15 de octubre de 08 BOLETÍN OCEÁNICO-ATMOSFERICO PACIFICO NORTE 1 al 15 de octubre de 08 PUNTOS
DISTRIBUCIÓN DE TEMPERATURA, SALINIDAD, OXÍGENO DISUELTO Y NUTRIENTES EN EL CANAL PULLUCHE-CHACABUCO, CHILE. (CRUCERO CIMAR 9 FIORDOS)*
*") Cienc. Tecnol. Mar, 31 (2): Características 29-43, 2008 oceanográficas físicas y químicas, canal Pulluche-Chacabuco 29 DISTRIBUCIÓN DE TEMPERATURA, SALINIDAD, OXÍGENO DISUELTO Y NUTRIENTES EN EL CANAL
Cienc. Tecnol. Mar, 31 (2): Características 29-43, 2008 oceanográficas físicas y químicas, canal Pulluche-Chacabuco 29 DISTRIBUCIÓN DE TEMPERATURA, SALINIDAD, OXÍGENO DISUELTO Y NUTRIENTES EN EL CANAL
En las clases anteriores consideramos una circulación atmosférica invariante. Claramente ese no es el caso en la Tierra y debemos entender de donde
 Por qué existe el tiempo? En las clases anteriores consideramos una circulación atmosférica invariante. Claramente ese no es el caso en la Tierra y debemos entender de donde aparecen las fluctuaciones
3.1 Temperatura y salinidad en canales y fiordos australes
 Temperatura y salinidad en canales y fiordos australes Avances en el conocimiento oceanográfico de las aguas interiores chilenas, Puerto Montt a cabo de Hornos. N. Silva & S. Palma (eds.) Comité Oceanográfico
ANTECEDENTES CURRICULARES
 ANTECEDENTES CURRICULARES 1.- ANTECEDENTES PERSONALES 1.1. NOMBRE: OSVALDO ENRIQUE ARTAL ARRIETA 1.2. FECHA NACIMIENTO: 21 de Mayo, 1986 1.3. R.U.T.: 16.418.652-0 1.4. Estado Civil: Casado. 1.5. CORREO
Cambios. Clima. Pesquerías Población mundial NOAA FAO. Mackenzie et al (2002) IAI 22Feb05-1
 IAI 22Feb05-1") Cambios Clima NOAA FAO Pesquerías Población mundial Flujo U.S. Bureau de of Nitrogeno the Census a la zona costera Mackenzie et al (2002) IAI 22Feb05-1 OCEANOGRAFÍA FÍSICA PORQUE? (Una lista incompleta
Cambios Clima NOAA FAO Pesquerías Población mundial Flujo U.S. Bureau de of Nitrogeno the Census a la zona costera Mackenzie et al (2002) IAI 22Feb05-1 OCEANOGRAFÍA FÍSICA PORQUE? (Una lista incompleta
Oceanos. Geosistemas ID Juan C. Benavides
 Oceanos Geosistemas ID 026671 Juan C. Benavides Composición química Componentes de los ambientes costeros Movimientos de las olas Barreras en islas Corales, ciénagas y manglares Oceanos Solidos en solución
Interpretación n del Cambio Climático a través s de indicadores marinos: temperatura, salinidad y nivel del mar.
 Interpretación n del Cambio Climático a través s de indicadores marinos: temperatura, salinidad y nivel del mar. Alicia Lavín Montero Instituto Español de Oceanografía El Océano en el clima El océano es
CARACTERIZACIÓN FÍSICA Y QUÍMICA Y MASAS DE AGUA EN LOS CANALES AUSTRALES DE CHILE ENTRE BOCA DEL GUAFO Y GOLFO ELEFANTES (CRUCERO CIMAR FIORDO 4)
") Cienc. Tecnol. Mar, 5 (): 5-7, Características físicas y químicas de los canales australes 5 CARACTERIZACIÓN FÍSICA Y QUÍMICA Y MASAS DE AGUA EN LOS CANALES AUSTRALES DE CHILE ENTRE BOCA DEL GUAFO Y GOLFO
Cienc. Tecnol. Mar, 5 (): 5-7, Características físicas y químicas de los canales australes 5 CARACTERIZACIÓN FÍSICA Y QUÍMICA Y MASAS DE AGUA EN LOS CANALES AUSTRALES DE CHILE ENTRE BOCA DEL GUAFO Y GOLFO
Principios básicos de climatología. Dra. Citlalli Aidee Becerril Tinoco
 Principios básicos de climatología Dra. Citlalli Aidee Becerril Tinoco Clima VS tiempo atmosférico Tiempo: estado específico de los diversos elementos atmosféricos, como radiación, humedad, presión, viento,
Unidad 11, 12, 13, 14 Calidad de agua en lagos y embalses
 Unidad 11, 12, 13, 14 en lagos y embalses Amplificación biológica de pesticidas en cadena trófica de un estuario Formación de lagos Ecosistemas en lagos y embalses: Luz y Zonificación Clasificación y tipos
ANTECEDENTES CURRICULARES
 ANTECEDENTES CURRICULARES 1.- ANTECEDENTES PERSONALES 1.1. NOMBRE: OSVALDO ENRIQUE ARTAL ARRIETA 1.2. FECHA NACIMIENTO: 21 de Mayo, 1986 1.3. R.U.T.: 16.418.652-0 1.4. Estado Civil: Casado. 1.5. CORREO
CORRIENTES DE MAREA EN CANAL PULLUCHE-BAJO ROEPKE
 CORRIENTES DE MAREA EN CANAL PULLUCHE-BAJO ROEPKE 117 Manuel Castillo Silva* Introducción Una de las características distintivas de las corrientes de marea en fiordos y canales es la evidente reversibilidad
REPORTE N 1 EVALUACIÓN DE LA CONDICIÓN DE LA BAHIA DE MEJILLONES. Centro de Investigación Aplicada del Mar S.A., CIAM Universidad de Antofagasta, UA
 REPORTE N 1 EVALUACIÓN DE LA CONDICIÓN DE LA BAHIA DE MEJILLONES Centro de Investigación Aplicada del Mar S.A., CIAM Universidad de Antofagasta, UA MAYO 2016 EVALUACIÓN DE LA CONDICIÓN OCEANOGRÁFICA EN
EVALUACIÓN DE TIERRAS PARA EL CULTIVO DEL AGUACATE DE ACUERDO CON EL CONOCIMIENTO LOCAL DEL PAISAJE EN LA REGIÓN DEL PICO DE TANCÍTARO, MICHOACÁN.
 UNIVERSIDAD NACIONAL AUTÓNOMA DE MÉXICO FACULTAD DE FILOSOFÍA Y LETRAS CENTRO DE INVESTIGACIONES EN GEOGRAFÍA AMBIENTAL EVALUACIÓN DE TIERRAS PARA EL CULTIVO DEL AGUACATE DE ACUERDO CON EL CONOCIMIENTO
Características Hidroclimáticasdel Gran Chaco Americano
 Características Hidroclimáticasdel Gran Chaco Americano Presente y Futuro CLIMA Y FACTORES QUE LO DETERMINAN Estado medio de los parámetros atmosféricos para un área en un periodo largo de tiempo (20-1.000.000
ANALISIS DE PARAMETROS OCEANOGRAFICOS Y ATMOSFERICOS DEL SENO DE RELONCAVI ANALYSIS OF OCEANOGRAPHIC AND ATMOSPHERIC PARAMETERS OF SENO DE RELONCAVI
 Gayana 73(1): 141-155, 2009 ISSN 0717-652X ANALISIS DE PARAMETROS OCEANOGRAFICOS Y ATMOSFERICOS DEL SENO DE RELONCAVI ANALYSIS OF OCEANOGRAPHIC AND ATMOSPHERIC PARAMETERS OF SENO DE RELONCAVI Luis Soto-Mardones
RESUMEN METEOROLÓGICO AÑO 2004 ESTACIÓN JORGE C. SCHYTHE 1 (53 08 S; W; 6 M S.N.M.)
") Anales Instituto Patagonia (Chile), 2005. 33: 65-71 65 RESUMEN METEOROLÓGICO AÑO 2004 ESTACIÓN JORGE C. SCHYTHE 1 (53 08 S; 70 53 W; 6 M S.N.M.) METEOROLOGICAL SUMMARY 2004, JORGE C. SCHYTHE STATION Nicolás
Anales Instituto Patagonia (Chile), 2005. 33: 65-71 65 RESUMEN METEOROLÓGICO AÑO 2004 ESTACIÓN JORGE C. SCHYTHE 1 (53 08 S; 70 53 W; 6 M S.N.M.) METEOROLOGICAL SUMMARY 2004, JORGE C. SCHYTHE STATION Nicolás
COMITÉ NACIONAL ERFEN QUININDÉ ESMERALDAS 12 DE NOVIEMBRE 2015
 COMITÉ NACIONAL ERFEN QUININDÉ ESMERALDAS 12 DE NOVIEMBRE 2015 Descripción del Evento El ciclo El Niño Oscilación del Sur es una variación climática interanual que ocurre naturalmente (El Niño-La Niña)
Circulación residual en el fiordo Aysén, Chile, en condiciones de primavera
 Vol. 52, N 2: 353-359, agosto 2017 DOI 10.4067/S0718-19572017000200014 ARTÍCULO Circulación residual en el fiordo Aysén, Chile, en condiciones de primavera Residual circulation in Aysén Fjord, Chile, during
Roberto Prado-Fiedler Facultad de Ciencias del Mar, Universidad de Valparaíso
 2.5 ESTABLECIMIENTO DE LOS FLUJOS PLUVIALES Y FLUVIALES DE NITRÓGENO BIOUTILIZABLE Y DE LA CONCENTRACIÓN DE AMONIO EN LAS AGUAS RECEPTORAS DE FIORDOS DE LA XI REGIÓN Roberto Prado-Fiedler Facultad de Ciencias
CIRCULACION OCEANICA Unidad 4
 CIRCULACION OCEANICA Unidad 4 Generalidades. Causas de las corrientes. Corrientes producidas por el viento y termohalinas.. Corrientes marinas de los océanos en general y del Atlántico Sur en particular.
Modelos Climáticos. María Jesús Casado Calle
 Modelos Climáticos María Jesús Casado Calle (mcasadoc@aemet.es) Clima El clima se suele definir en sentido restringido como el estado promedio del tiempo y, más rigurosamente, como una descripción estadística
Intrusión marina y caracterización hidrogeológica del acuífero costero Laguna Agua Grande en Sinaloa, México
 Intrusión marina y caracterización hidrogeológica del acuífero costero Laguna Agua Grande en Sinaloa, México Carlos Rosado de Palacio 15 de octubre de 2015 Contenido 1. Introducción 2. Área de estudio
HELLMUTH A. SIEVERS (1) (2, 3) CAROLINA CALVETE M. NELSON SILVA S. (2) (1) Facultad de Ciencias del Mar, Universidad de Valparaíso (2)
 (2, 3) CAROLINA CALVETE M. NELSON SILVA S. (2) (1) Facultad de Ciencias del Mar, Universidad de Valparaíso (2)") Cienc. Tecnol. Mar, 25 Distribución (2): 17-43, de 22 características físicas, masas de agua y circulación general 17 DISTRIBUCIÓN DE CARACTERÍSTICAS FÍSICAS, MASAS DE AGUA Y CIRCULACIÓN GENERAL PARA ALGUNOS
Cienc. Tecnol. Mar, 25 Distribución (2): 17-43, de 22 características físicas, masas de agua y circulación general 17 DISTRIBUCIÓN DE CARACTERÍSTICAS FÍSICAS, MASAS DE AGUA Y CIRCULACIÓN GENERAL PARA ALGUNOS
Informe Correntometria Lagrangeana. Estuario Reloncavi Noviembre 2014
 Informe Correntometria Lagrangeana. Estuario Reloncavi Noviembre 214 1. Introducción El agua de mar, en constante movimiento, sufre desplazamientos que provocan, la formación de olas, mareas y corrientes.
CONTROL HIDRÁULICO Y EFECTO DEL VIENTO SOBRE EL FLUJO EN LA CONSTRICCIÓN DE MENINEA*
 Cienc. Tecnol. Mar, Control 3 (1): hidráulico 73-87, 7y efecto del viento sobre el flujo en la constricción de Meninea 73 CONTROL HIDRÁULICO Y EFECTO DEL VIENTO SOBRE EL FLUJO EN LA CONSTRICCIÓN DE MENINEA*
3. Circulación Oceánica y Clima
 Módulo I: Motores de la Biosfera 3. Circulación Oceánica y Clima Capítulo 14 Calentamiento y nivel del mar Joaquim Ballabrera Unitat de Tecnologia Marina, CSIC, Barcelona joaquim@cmima.csic.es Introducción
2.1 Topografía submarina en canales de la Patagonia Norte
 Topografía submarina en es de la Patagonia Norte Avances en el conocimiento oceanográfico de las aguas interiores chilenas, Puerto Montt a cabo de Hornos. N. Silva & S. Palma (eds.) Comité Oceanográfico
Glaciares y casquetes polares. Hielo oceánico. Suelo congelado (permafrost) Criosfera. Capas de hielo continental. Hielo en ríos y lagos
 Criosfera. Capas de hielo continental. Hielo en ríos y lagos") Nieve Hielo oceánico Glaciares y casquetes polares Suelo congelado (permafrost) Criosfera Capas de hielo continental Hielo en ríos y lagos La criosfera contribuye al albedo terrestre Influencia la circulación
Nieve Hielo oceánico Glaciares y casquetes polares Suelo congelado (permafrost) Criosfera Capas de hielo continental Hielo en ríos y lagos La criosfera contribuye al albedo terrestre Influencia la circulación
UNIVERSIDAD ARTURO PRAT PROGRAMA BIO-OCEANOGRÁFICO-PESQUERO DE LA ZONA NORTE DE CHILE (18 S-23 S) UNAP-CIAM
 UNAP-CIAM") UNIVERSIDAD ARTURO PRAT FACULTAD DE RECURSOS NATURALES RENOVABLES PROGRAMA BIO-OCEANOGRÁFICO-PESQUERO DE LA ZONA NORTE DE CHILE (18 S-23 S) UNAP-CIAM RESULTADOS PRELIMINARES CRUCERO BIO-OCEANOGRAFICO DE
UNIVERSIDAD ARTURO PRAT FACULTAD DE RECURSOS NATURALES RENOVABLES PROGRAMA BIO-OCEANOGRÁFICO-PESQUERO DE LA ZONA NORTE DE CHILE (18 S-23 S) UNAP-CIAM RESULTADOS PRELIMINARES CRUCERO BIO-OCEANOGRAFICO DE
Oceanografía
 Unidad responsable: Unidad que imparte: Curso: Titulación: Créditos ECTS: 2017 280 - FNB - Facultad de Náutica de Barcelona 751 - DECA - Departamento de Ingeniería Civil y Ambiental MÁSTER UNIVERSITARIO
OCEANOGRAFÍA FÍSICA PORQUE? (Una lista incompleta y seguramente desequilibrada)
") OCEANOGRAFÍA FÍSICA PORQUE? (Una lista incompleta y seguramente desequilibrada) * NAVEGACIÓN: TRANSPORTE MARÍTIMO COMERCIAL Las olas, corrientes superficiales y las * DEFENSA Y GUERRA NAVAL Las olas, corrientes
OCEANOGRAFÍA FÍSICA PORQUE? (Una lista incompleta y seguramente desequilibrada) * NAVEGACIÓN: TRANSPORTE MARÍTIMO COMERCIAL Las olas, corrientes superficiales y las * DEFENSA Y GUERRA NAVAL Las olas, corrientes
Variaciones de la turbidez del agua litoral: coeficiente de atenuación difusa (K-490). Evolución Situación Tendencia
. Evolución Situación Tendencia") 1. Título del indicador Variaciones de la turbidez del agua litoral: coeficiente de atenuación difusa (K-490). 2. Equivalencia con otros sistemas de indicadores Ministerio de Agricultura, Alimentación
1. Título del indicador Variaciones de la turbidez del agua litoral: coeficiente de atenuación difusa (K-490). 2. Equivalencia con otros sistemas de indicadores Ministerio de Agricultura, Alimentación
Clima CO08/2701 CO08/2700
 Clima La climatología se describe con base en datos recolectados desde 1961 a 1991 de una estación sinóptica principal, del IDEAM, localizada en el aeropuerto Sesquicentenario en la Isla de San Andrés,
Introducción a la Acústica Submarina ACU402, Clase 1. Alejandro Osses Vecchi
 Introducción a la Acústica Submarina ACU402, Clase 1 Alejandro Osses Vecchi Resumen Acústica en el estudio de la actividad submarina. Oceanografía básica. Geología y topografía del fondo marino chileno.
Cambios Espacio Temporales de la Clorofila-a en el Sistema Norte de la Corriente de Humboldt
 IAI 3094 Evaluación de los servicios ecosistémicos marinos en las estaciones de serie de tiempo de la red latinoamericana Antares Cambios Espacio Temporales de la Clorofila-a en el Sistema Norte de la
COMPORTAMIENTO DE LA TEMPERATURA DE LA SUPERFICIE DEL MAR EN EL PACIFICO ECUATORIAL Y OSCILACIÓN DEL SUR SEMANA DEL 27 DE MAYO AL 03 DE JUNIO DE 2017
 COMPORTAMIENTO DE LA TEMPERATURA DE LA SUPERFICIE DEL MAR EN EL PACIFICO ECUATORIAL Y OSCILACIÓN DEL SUR SEMANA DEL 27 DE MAYO AL 03 DE JUNIO DE 2017 06 DE JUNIO DE 2017 VARIACIONES DE LA TEMPERATURA DE
4.1 Masas de agua y circulación en los canales y fiordos australes
 Masas de agua y circulación en los canales y fiordos australes Avances en el conocimiento oceanográfico de las aguas interiores chilenas, Puerto Montt a cabo de Hornos. N. Silva & S. Palma (eds.) Comité
INSTITUTO DEL MAR DEL PERÚ
 INSTITUTO DEL MAR DEL PERÚ IMARPE CONDICIONES DEL AMBIENTE MARINO AL 02 MARZO 2015 Ing. Luis Pizarro P. Instituto del Mar del Perú PROMEDIOS DE ANOMALÍAS DE LA TSM EN LAS ULTIMAS CUATRO SEMANAS Período
Glaciares y casquetes polares. Hielo oceánico. Suelo congelado (permafrost) Criosfera. Capas de hielo continental. Hielo en ríos y lagos
 Criosfera. Capas de hielo continental. Hielo en ríos y lagos") Nieve Hielo oceánico Glaciares y casquetes polares Suelo congelado (permafrost) Criosfera Capas de hielo continental Hielo en ríos y lagos La criosfera contribuye al albedo terrestre Influencia la circulación
Nieve Hielo oceánico Glaciares y casquetes polares Suelo congelado (permafrost) Criosfera Capas de hielo continental Hielo en ríos y lagos La criosfera contribuye al albedo terrestre Influencia la circulación
ELABORADO POR: ECONATURA, A.C.
 ESTUDIO Y CONSERVACIÓN DE LA NATURALEZA, A. C. Mariano Azuela 194 Col. Sta. Ma. La Ribera, Del. Cuauhtémoc México, D.F. 06400. econatura@econatura.org.mx, econaturaac@gmail.com ESTUDIO DE LA HIDRODINÁMICA
El nuevo chico en el barrio El Niño Godzilla
 El nuevo chico en el barrio El Niño Godzilla Eduardo Santamaría-del-Ángel Universidad Autónoma de Baja California Facultad de Ciencias Marinas ANTARES-Chloro-GIN Co-chair GEO-CIEHLYC santamaria@uabc.edu.mx
ÁREAS DE RETENCIÓN DE LARVAS DE PECES EN LOS CANALES UBICADOS AL OCCIDENTE DEL CANAL MORALEDA, CHILE (43º39 45º49 LAT. S)
") ÁREAS DE RETENCIÓN DE LARVAS DE PECES EN LOS CANALES UBICADOS AL OCCIDENTE DEL CANAL MORALEDA, CHILE (43º39 45º49 LAT. S) Fernando Balbontín y Gloria Córdova Facultad de Ciencias del Mar, Universidad de
ÁREAS DE RETENCIÓN DE LARVAS DE PECES EN LOS CANALES UBICADOS AL OCCIDENTE DEL CANAL MORALEDA, CHILE (43º39 45º49 LAT. S) Fernando Balbontín y Gloria Córdova Facultad de Ciencias del Mar, Universidad de
Reporte datos CTD Moomz Junio, 2008.
 Reporte datos CTD Moomz Junio, 2008. Nadín Ramírez Riveros Metodología En una transecta perpendicular a la costa se ubicaron 7 estaciones hidrográficas (Figura 1) y en estas se realizaron 40 perfiles de
BOLETIN OCEANICO- ATMOSFERICO
 DIRECCION GENERAL DE INVESTIGACION PESQUERA DEL PACIFICO NORTE BOLETIN OCEANICO- ATMOSFERICO VOLUMEN 1 No. 1 15 de septiembre de 2008 BOLETÍN OCEÁNICO-ATMOSFERICO SEMANAL PACIFICO NORTE 15 de septiembre
TENDENCIA Y ESTACIONALIDAD DE LA PRECIPITACIÓN EN BALCARCE. Irigoyen, A.I. (1); Suero, E.E.; J.M.Gardiol
; Suero, E.E.; J.M.Gardiol") TENDENCIA Y ESTACIONALIDAD DE LA PRECIPITACIÓN EN BALCARCE. Irigoyen, A.I. (1); Suero, E.E.; J.M.Gardiol (1) Unidad Integrada: Facultad de Ciencias Agrarias UNMdP -EEA INTA Balcarce. Argentina. e-mail:
TENDENCIA Y ESTACIONALIDAD DE LA PRECIPITACIÓN EN BALCARCE. Irigoyen, A.I. (1); Suero, E.E.; J.M.Gardiol (1) Unidad Integrada: Facultad de Ciencias Agrarias UNMdP -EEA INTA Balcarce. Argentina. e-mail:
12. Regiones bajo la influencia de descarga de agua dulce
 12. Regiones bajo la influencia de descarga de agua dulce En latitudes medias la contribución de la precipitación y evaporación a la estabilidad de la columna es generalmente pequeña comparada con la influencia
Variaciones de la turbidez del agua litoral: coeficiente de atenuación difusa (K-490). Evolución Situación Tendencia
. Evolución Situación Tendencia") 1. Título del indicador Variaciones de la turbidez del agua litoral: coeficiente de atenuación difusa (K-490). 2. Equivalencia con otros sistemas de indicadores Ministerio de Agricultura, Alimentación
1. Título del indicador Variaciones de la turbidez del agua litoral: coeficiente de atenuación difusa (K-490). 2. Equivalencia con otros sistemas de indicadores Ministerio de Agricultura, Alimentación
BOLETIN DIARIO DE LAS CONDICIONES OCEANOGRÁFICAS
 TEMPERATURA SUPERFICIAL DEL MAR La Dirección de Hidrografía y Navegación (DHN) como miembro del Comité Multisectorial del Estudio Nacional del Fenómeno El Niño (ENFEN), tiene el compromiso de la evaluación
VIII Jornadas Chilenas de Sismología e Ingeniería Antisísmica, Valparaíso, Abril, CARACTERISTICAS DEL TERREMOTO DE OCOÑA DEL 23 DE JUNIO DE 2001
 VIII Jornadas Chilenas de Sismología e Ingeniería Antisísmica, Valparaíso, Abril, 2002. CARACTERISTICAS DEL TERREMOTO DE OCOÑA DEL 23 DE JUNIO DE 2001 Rubén Boroschek 1, Diana Comte 2, Alexis Morales 1
Introducción a la Dinámica del Océano. Convección: Figuras clases Convección y Circulación de la Atmósfera
 Convección: Figuras clases Convección y Circulación de la Atmósfera 1 2 Conceptos importantes: La atmósfera está compuesta por capas cuya existencia es consecuencia de la absorción por diferentes gases.
PERFILADOR DE CORRIENTES ACÚSTICO DOPPLER (ADCP) Una Efectiva Herramienta de Decisión Estratégica para la Industria Salmonera Nacional
 Una Efectiva Herramienta de Decisión Estratégica para la Industria Salmonera Nacional") PERFILADOR DE CORRIENTES ACÚSTICO DOPPLER (ADCP) Una Efectiva Herramienta de Decisión Estratégica para la Industria Salmonera Nacional Preparado por: Agosto, 2002 PERFILADOR DE CORRIENTES ACÚSTICO DOPPLER
PERFILADOR DE CORRIENTES ACÚSTICO DOPPLER (ADCP) Una Efectiva Herramienta de Decisión Estratégica para la Industria Salmonera Nacional Preparado por: Agosto, 2002 PERFILADOR DE CORRIENTES ACÚSTICO DOPPLER
Clasificación de Estuarios
 Capitulo 4 Clasificación de Estuarios Tabla de Contenido Clasificación de estuarios de acuerdo a sus propiedades de circulación y la distribución asociada de estado continuo de la salinidad Algunas características:
Circulación general de la atmósfera
 Circulación general de la atmósfera Altura de la tropopausa Ecuación hipsométrica: ecuacion de estado + ecuación hidrostática. Relaciona distribución de masa en altura con temperatura de la columna atmosférica.
Seminario 2013 Quiero exportar mi fruta; tengo clientes, mercados, productos y ahora qué?
 Seminario 2013 Quiero exportar mi fruta; tengo clientes, mercados, productos y ahora qué? Características Climáticas de la Región de Atacama: Actualidad y Proyección Cristóbal Juliá de la Vega Meteorólogo
EFECTO ANTROPICO SOBRE LOS FLUJOS DE N y P EN EL SISTEMA DE AFLORAMIENTO COSTERO DE LA RIA DE VIGO
 EFECTO ANTROPICO SOBRE LOS FLUJOS DE N y P EN EL SISTEMA DE AFLORAMIENTO COSTERO DE LA RIA DE VIGO Los aportes de nutrientes orgánicos e inorgánicos de nitrógeno (N) y fósforo (P) a la Ría de Vigo, al
UNIVERSIDAD DE CONCEPCIÓN
 UNIVERSIDAD DE CONCEPCIÓN FACULTAD DE CIENCIAS FÍSICAS Y MATEMÁTICAS DEPARTAMENTO DE GEOFÍSICA Estimaciones de los tiempos de recambio en fiordos de la provincia de Aysén, Chile Valentina Isabel Olmos
Monitoreo de las Condiciones Climáticas Octubre de 2015
 Monitoreo de las Condiciones Climáticas Octubre de 2015 a. Temperatura del Aire El régimen de temperatura media durante octubre, mostró en promedio un mes más frío que su valor climatológico desde Santiago
LIMNOLOGÍA. LICENCIATURA EN GESTIÓN AMBIENTAL CURE/Facultad de Ciencias UdelaR
 LIMNOLOGÍA LICENCIATURA EN GESTIÓN AMBIENTAL CURE/Facultad de Ciencias UdelaR Ambiente/abiótico Maldonado, 2016 Estructura microscópica estratificación Molécula dipolar (atracciones intensas) Puentes de
CAPITULO VII CIRCULACION Y MASAS DE AGUA DE LOS OCEANOS
 CAPITULO VII CIRCULACION Y MASAS DE AGUA DE LOS OCEANOS INTRODUCCION Debe ser claro que de una forma u otra la energía o la radiación del sol es la responsable de la circulación en los océanos. Esta produce