DIRECCIÓN DE INFORMACIÓN Y COMUNICACIÓN SOCIAL
|
|
|
- Ana Isabel Juárez Rojas
- hace 7 años
- Vistas:
Transcripción
1 Press release No. 015 Distrito Federal, Mexico, December 2, CONEVAL PRESENTS 2010 POVERTY LEVELS FOR EACH MEXICAN MUNICIPALITY With the publication of the 2010 poverty estimates for Mexico s 2456 municipalities, CONEVAL abides by the mandate derived from the General Law of Social Development. Municipal level poverty estimates contribute to increased accountability and to more comprehensive policy planning. The following are the municipalities with the highest percentage of their population in poverty in 2010: San Juan Tepeuxila, Oaxaca (97.4); Aldama, Chiapas (97.3); San Juan Cancuc, Chiapas (97.3); Mixtla de Altamirano, Veracruz (97.0); Chalchihuitán, Chiapas (96.8); Santiago Textitlán, Oaxaca (96.6); San Andrés Duraznal, Chiapas (96.5); Santiago el Pinar, Chiapas (96.5); Sitalá, Chiapas (96.5), and San Simón Zahuatlán, Oaxaca (96.4). The following municipalities exhibit the lowest percentage of their population in poverty: Benito Juárez, Federal District (8.7); San Nicolás de los Garza, Nuevo León (12.8); Guadalupe, Nuevo León (13.2); Miguel Hidalgo, Federal District (14.3); San Pedro Garza García, Nuevo León (15.2); San Sebastián Tutla, Oaxaca (16.7); San Pablo Etla, Oaxaca (17.3); Apodaca, Nuevo León (18.0); Corregidora, Querétaro (18.7), and San Juan de Sabinas, Coahuila (19.0). The municipalities with the largest absolute number of persons living in poverty are: Puebla, Puebla (732,154); Iztapalapa, Federal District (727,128); Ecatepec de Morelos, México (723,559); León, Guanajuato (600,145); Tijuana, Baja California (525,769); Juárez, Chihuahua (494,726); Nezahualcóyotl, México (462,405); Toluca, México (407,691); Acapulco de Juárez, Guerrero (405,499), and Gustavo A. Madero, Federal District (356,328). Mexico City.- The National Council for the Evaluation of Social Development Policy (CONEVAL) announces municipal level poverty estimates for CONEVAL is the official Mexican agency in charge of poverty measurement 1 and the evaluation of social policy. In July, 2011, it released national and state level poverty estimates for 2008 and In Mexico, the official methodology for poverty measurement is multidimensional in nature. Poverty is measured in two basic spaces: income and social deprivation. Social deprivation includes six dimensions. Each dimension is defined as the deprivation of a social right. The threshold dividing deprivation from fulfillment is derived from each specialized body of Mexican law. 1 Link a la página de medición nacional y estatal 2008 y
2 Today, CONEVAL releases, for the first time, municipal poverty estimates that include the social and economic dimensions defined by law (LGDS): income, schooling, access to health services, access to social security, dwelling quality and space, basic services available to the dwelling, access to food and level of social cohesion. According to the law, CONEVAL must measure poverty at the state level every two years, and at the municipal level every five. To this end, it must make use of the information collected by the National Institute of Statistics and Geography (INEGI). Today s presentation fulfills the totality of these mandates. The municipal poverty estimates released today, together with those published this past July at the national and state levels, comprise a territorially comprehensive diagnosis of some of the country s main social development issues. The availability of these municipal level estimates strengthens accountability and is intended ti help improve planning of social development policy. POVERTY AND EXTREME POVERTY According to the methodology for poverty measurement, the population living in poverty is defined as that exhibiting at least one social deprivation and an income below the well being threshold. Municipalities with the largest percentage of persons living in poverty in 2010 were: San Juan Tepeuxila, Oaxaca (97.4); Aldama, Chiapas (97.3); San Juan Cancuc, Chiapas (97.3); Mixtla de Altamirano, Veracruz (97.0); Chalchihuitán, Chiapas (96.8); Santiago Textitlán, Oaxaca (96.6); San Andrés Duraznal, Chiapas (96.5); Santiago el Pinar, Chiapas (96.5); Sitalá, Chiapas (96.5), and San Simón Zahuatlán, Oaxaca (96.4) Of the above, in eight municipalities 70 percent or more of the population speaks an indigenous language, i.e., they are indigenous municipalities. In San Juan Tepeuxila the percentage of persons speaking an indigenous language is 57 percent, and in Santiago Textitlán it is 14 percent. The following municipalities show the lowest percentage of persons living in poverty: Benito Juárez, Federal District (8.7); San Nicolás de los Garza, Nuevo León (12.8); Guadalupe, Nuevo León (13.2); Miguel Hidalgo, Federal District (14.3); San Pedro Garza García, Nuevo León (15.2); San Sebastián Tutla, Oaxaca (16.7); San Pablo Etla, Oaxaca (17.3); Apodaca, Nuevo León (18.0); Corregidora, Querétaro (18.7), and San Juan de Sabinas, Coahuila (19.0). In all of the above municipalities, the indigenous population accounts for less than 10 percent of the total. Municipalities with the greatest absolute number of persons in poverty are: Puebla, Puebla (732,154); Iztapalapa, Federal District (727,128); Ecatepec de Morelos, México (723,559); León, Guanajuato (600,145); Tijuana, Baja California (525,769); Juárez, Chihuahua (494,726); Nezahualcóyotl, México (462,405); Toluca, México (407,691); Acapulco de Juárez, Guerrero (405,499), and Gustavo A. Madero, Federal District (356,328).
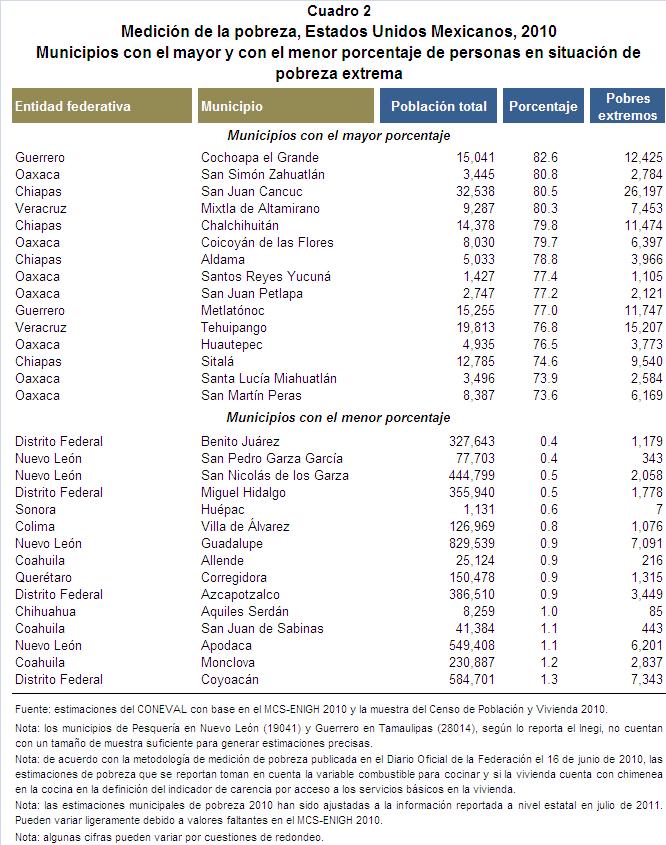
3 Half of all the population living in poverty resides in 190 municipalities. Of these, 166 show scant indigenous presence; 16 moderate indigenous presence; and the remaining eight are predominantly indigenous. 2 All 257 indigenous municipalities possess poverty levels above 55 percent. In six of them, the percentage of persons living in poverty was above 70 percent. Secondly, the population living in extreme poverty is defined as that with three or more social deprivations and an income below the minimum well being threshold. Municipalities with the highest percentage of persons living in extreme poverty are: Cochoapa el Grande, Guerrero (82.6); San Simón Zahuatlán, Oaxaca (80.8); San Juan Cancuc, Chiapas (80.5); Mixtla de Altamirano, Veracruz (80.3); Chalchihuitán, Chiapas (79.8); Coicoyán de las Flores, Oaxaca (79.7); Aldama, Chiapas (78.8); Santos Reyes Yucuná, Oaxaca (77.4); San Juan Petlapa, Oaxaca (77.2), and Metlatónoc, Guerrero (77.0). In these municipalities, 70 percent or more of their population speaks an indigenous language, that is to say they are indigenous. In the following municipalities (or, in the case of the Federal District, delegations), the population living in extreme poverty is below one percent: Benito Juárez, Federal District; San Pedro Garza García, Nuevo León; San Nicolás de los Garza, Nuevo León; Miguel Hidalgo, Federal District; Huépac, Sonora; Villa de Álvarez, Colima; Guadalupe, Nuevo León; Allende, Coahuila; Corregidora, Querétaro, and Azcapotzalco, Federal District. Municipalities with the largest absolute number of persons living in extreme poverty are: Ocosingo, Chiapas (144,088); Puebla, Puebla (110,012); Acapulco de Juárez, Guerrero (107,048); Ecatepec de Morelos, México (107,023); Chilón, Chiapas (87,519); Las Margaritas, Chiapas (75,339); Toluca, México (66,938); León, Guanajuato (66,687); Iztapalapa, Federal District (63,017), and Juárez, Chihuahua (62,822). Extreme poverty among indigenous municipalities was above 16 percent, and in 169 of them, extreme poverty levels are above 50 percent. Population without social deprivations and with income above the well being threshold Municipalities with the highest percentage of their population with an income above the well being threshold and without social deprivations (i.e., a population that is neither poor nor vulnerable) are as follows: Benito Juárez, Federal District (51.1); San Sebastián Tutla, Oaxaca (50.5); San Nicolás de los Garza, Nuevo León (48.7); Zacatecas, Zacatecas (45.0); Apodaca, Nuevo León (44.0); Guadalupe, Nuevo León (43.9); Monclova, Coahuila (43.4); Miguel Hidalgo, Federal District (43.2); Santa María del Tule, Oaxaca (41.5), and San Juan de Sabinas, Coahuila (40.8). 2 Indigenous muncipality : 70% or more of its population aged 5 years old and above speaks an indigenous language (in Spanish, HLI). Predominantly indigenous municipality : At least 40% and less than 70% of its population speaks an indigenous language. Municipalities with moderate indigenous presence : Speakers of indigenous languages comprise from 10 to under 40% of the population. Municipiality with scant indigenous presence : Less than 10 percent of its population is HLI. 2
4 Additionally, the municipalities with the largest absolute number of persons in the above category are: Guadalajara, Jalisco (504,391); Iztapalapa, Federal District (461,717); Zapopan, Jalisco (431,153); Puebla, Puebla (427,448); Monterrey, Nuevo León (421,640); León, Guanajuato (376,204); Guadalupe, Nuevo León (364,167); Gustavo A. Madero, Federal District (356,807); Ecatepec de Morelos, México (346,958), and Tijuana, Baja California (337,818). DIMENSIONS OF MUNICIPAL POVERTY, 2010 Deprivations Access to social security Out of the 2,456 municipalities, in 2,294, or 93.4% more than 50% of the population lacks access to social security. The municipalities with the highest percentage of their population lacking access to social security are: San Pedro Quiatoni, Oaxaca (99.3); Santa Lucía Miahuatlán, Oaxaca (98.9); Santiago el Pinar, Chiapas (98.8); San Simón Zahuatlán, Oaxaca (98.7); San Dionisio Ocotepec, Oaxaca (98.6); San Francisco Logueche, Oaxaca (98.6); San Andrés Paxtlán, Oaxaca (98.6); Santiago Yaitepec, Oaxaca (98.5); Mixtla de Altamirano, Veracruz (98.4), and Aldama, Chiapas (98.4). The municipalities with the lowest percentage of their population without access to social security are: Nacozari de García, Sonora (24.2); Nava, Coahuila (25.2); Apodaca, Nuevo León (26.7); Monclova, Coahuila (26.8) San Juan de Sabinas, Coahuila (26.9); Sierra Mojada, Coahuila (27.1); Frontera, Coahuila (28.0); Acuña, Coahuila (28.0); Gral. Zuazua, Nuevo León (28.9), and Piedras Negras, Coahuila (29.0). Access to health services Of the 2,456 municipalities, in 420, or 17.1%, at least 50% of the population lacks access to health services. The municipalities with the highest percentage of their population lacking access to health are: San Juan Yatzona, Oaxaca (98.4); Abejones, Oaxaca (98.1); San Juan Teita, Oaxaca (98.0); Santiago Nundiche, Oaxaca (97.6); San Andrés Yaá, Oaxaca (96.9); San Bartolomé Yucuañe, Oaxaca (96.8); Santa Ana Yareni, Oaxaca (96.0); San Felipe Tepatlán, Puebla (95.8); Santa María Zoquitlán, Oaxaca (95.6), and Santo Domingo Tlatayápam, Oaxaca (95.5). The municipalities with the lowest percentage of their population without access to health services are: Santo Domingo Albarradas, Oaxaca (1.4); San Mateo Tlapiltepec, Oaxaca (2.4); Tecoh, Yucatán (2.6); San Sebastián Nicananduta, Oaxaca (2.8); Bokobá, Yucatán (4.2); San Francisco Cahuacuá, Oaxaca (4.3); Jaumave, Tamaulipas (4.4); Xochihuehuetlán, Guerrero (4.7); San Mateo Yucutindó, Oaxaca (4.7), and San Antonino Monte Verde, Oaxaca (4.7). Access to food In four percent of all municipalities, 50% of the population or more suffers from food deprivation. The following ten municipalities showed the highest levels of this deprivation: San Bartolomé Ayautla, Oaxaca (78.4); San Cristóbal Amatlán, Oaxaca (76.5); San Martín Itunyoso, Oaxaca (74.2); San Miguel Chicahua, Oaxaca (69.5); Yaxe, Oaxaca (68.6); Chanal, Chiapas (68.0); Huautepec, Oaxaca (66.9); San Pedro Coxcaltepec Cántaros, Oaxaca (66.6); Santa Cruz Acatepec, Oaxaca (66.6), y San Miguel Huautla, Oaxaca (66.5).
5 4 The municipalities with the lowest percentage of their population with food deprivation are: Ciénega de Zimatlán, Oaxaca (4.2); San Juan Evangelista Analco, Oaxaca (4.2), Dr. Belisario Domínguez, Chihuahua (4.5); Parás, Nuevo León (4.7); San Miguel Tulancingo, Oaxaca (4.8); Dr. Coss, Nuevo León (4.9); Los Aldamas, Nuevo León (4.9); San Juan Achiutla, Oaxaca (5.7); San Francisco de Borja, Chihuahua (5.7), and Benito Juárez, Federal District (6.5). Provision of basic services to the dwelling: Of the 2,456 municipalities, in 1,179, or 48%, 50% or more of the population lacks access to basic services to the dwelling. The municipalities with the highest percentage of their population lacking access to basic services are: Magdalena Mixtepec, San Andrés Nuxiño, San Cristóbal Amoltepec, San Francisco Logueche, San Juan Lachigalla, San Juan Petlapa, San Juan Teita, San Lorenzo Cuaunecuiltitla, San Lucas Camotlán, San Martín Itunyoso, San Pedro Mártir, San Pedro Mártir Quiechapa, Santa Catalina Quierí, Santa Catarina Quioquitani, Santa Cruz Tacahua, Santa María Yosoyúa, Santiago Nundiche, Santo Domingo Nuxaá. In this municipalities, the entire population suffered deprivation in The municipalities with the lowest percentage of their population without access to basic housing services are: San Nicolás de los Garza, Nuevo León (0.1); Benito Juárez, Federal District (0.1); Miguel Hidalgo, Federal District (0.1); San Pedro Garza García, Nuevo León (0.2); Coacalco de Berriozábal, México (0.2); Venustiano Carranza, Federal District (0.3); Guadalajara, Jalisco (0.4); Iztacalco, Federal District (0.5); Apodaca, Nuevo León (0.6), and Azcapotzalco, Federal District (0.6). Schooling Of the 2,456 muncipalities, in 87, or 3.5%, 50% of the population exhibited insufficient levels of schooling. The municipalities with the highest percentages of deprivation in schooling are: San Miguel Santa Flor, Oaxaca (67.7); Magdalena Teitipac, Oaxaca (65.1); San Miguel Ahuehuetitlán, Oaxaca (64.8); Ixpantepec Nieves, Oaxaca (64.3); San Mateo Nejápam, Oaxaca (62.5); Yogana, Oaxaca (61.7); Zapotitlán Lagunas, Oaxaca (61.5); Santiago Texcalcingo, Oaxaca (61.5); Santiago Yaitepec, Oaxaca (61.3), and Asunción Ocotlán, Oaxaca (61.1). The municipalities with the lowest percentage of their population without sufficient schooling are: Benito Juárez, Federal District (3.7); San Sebastian Tutla, Oaxaca (4.8); Guelatao de Juárez, Oaxaca (5.4); Miguel Hidalgo, Federal District (6.0); Corregidora, Querétaro (6.3); Coyoacán, Federal District (7.5); Tlaxcala, Tlaxcala (7.8); Azcapotzalco, Federal District (8.0); Venustiano Carranza, Federal District (8.1), and Cuauhtémoc, Federal District (8.2). Housing quality and space Of the 2,456 municipalities, in 225, or 9.2%, 50% or more of the population is socially deprived due to the poor quality of construction, or the lack of space in their house. 5 Municipalities with the highest percentage of their population with this deprivation are: San Miguel Piedras, Oaxaca (88.1); San Pedro Mártir, Oaxaca (85.8); San Mateo del Mar, Oaxaca (84.5); San José Tenango, Oaxaca (81.8); Tanlajás, San Luis Potosí (81.3); San Bartolomé Ayautla, Oaxaca (79.9); Cochoapa el Grande, Guerrero (79.1); San Miguel Coatlán, Oaxaca (77.5); San Martín Itunyoso, Oaxaca (77.4), and Chalchihuitán, Chiapas (77.2).
6 The municipalities with the lowest percentage of their population socially deprived in terms of housing are: Santa Magdalena Jicotlán, Oaxaca sin población con esta carencia; Atil, Sonora (0.8); Santa Isabel, Chihuahua (1.1); San Julián, Jalisco (1.2); Valle de Guadalupe, Jalisco (1.5); Cusihuiriachi, Chihuahua (1.7); Ignacio Zaragoza, Chihuahua (1.7); Corregidora, Querétaro (1.8); Mier, Tamaulipas (1.8), and Abasolo, Coahuila (1.8). Income The methodology includes two income cut-off points: The well being line, defined as the sum of the cost of a basket comprising food and non-food items, and the minimum well being line, equal to the cost of a food basket. The Mexican food basket was re-defined by CONEVAL to include proteins, calories and micronutrients. These thresholds allow estimations of the percentage and number of individuals / households with less than sufficient income to purchase these two baskets. In August, 2010, that is to say when the Census was in the field, the value of the well being line was $2,114 pesos per month per person in urban areas, and $1,329 pesos per month in rural areas. The corresponding valued for the minimum well being line were $978 pesos per month per person in urban areas and $684 pesos in rural areas. The municipalities with the highest percentage of their population with an income below the well being line are the following: San Juan Tepeuxila, Oaxaca (97.5); Aldama, Chiapas (97.3); San Juan Cancuc, Chiapas (97.3); Mixtla de Altamirano, Veracruz (97.0); Chalchihuitán, Chiapas (96.8); Santa María Quiegolani, Oaxaca (96.7); Santiago Textitlán, Oaxaca (96.6); San Andrés Duraznal, Chiapas (96.6); Santiago el Pinar, Chiapas (96.5), and Sitalá, Chiapas (96.5). The municipalities with the highest percentage of their population with an income below the minimum well being line are: Aldama, Chiapas (85.8); Mixtla de Altamirano, Veracruz (85.0); Santa María Quiegolani, Oaxaca (84.7); Sitalá, Chiapas (84.3); Chalchihuitán, Chiapas (83.9); San Juan Cancuc, Chiapas (83.8); San Juan Tepeuxila, Oaxaca (83.7); San Simón Zahuatlán, Oaxaca (83.6); Santiago el Pinar, Chiapas (83.2), and Cochoapa el Grande (83.0). Social cohesion In this methodology, one of the indicators of social cohesion is the Gini coefficient, which measures income inequality. This indicator is estimated on the basis of the current total per capita income of the households, and ranges from zero to one: the greater the coefficient, the greater the level of income inequality. The municipalities with the highest values in this index (and greatest income inequality) are: Armería, Colima (0.591); General Plutarco Elías Calles, Sonora (0.567); Zongolica, Veracruz (0.558); Constancia del Rosario, Oaxaca (0.554); Yajalón, Chiapas (0.551); Carbó, Sonora (0.550); Atlatlahucan, Morelos (0.550); Guachochi, Chihuahua (0.549); Altamirano, Chiapas (0.548), and San Juan Yucuita, Oaxaca (0.547). The municipalities that, on the contrary showed the least income inequality, and therefore the lowest levels of income concentration, were: Santiago Tepetlapa, Oaxaca (0.286); San Juan Yatzona, Oaxaca (0.307); Santo Domingo Tonaltepec (0.309); Santo Domingo Tlatayápam, Oaxaca (0.310); Santa Magdalena Jicotlán, Oaxaca (0.311); San Antonio Acutla, Oaxaca (0.311); San Juan Evangelista Analco, Oaxaca (0.314); San Mateo Tlapiltepec, Oaxaca (0.315); San Juan Achiutla, Oaxaca (0.317), and Telchac Puerto, Yucatán (0.324).
7 oo00oo ABOUT CONEVAL CONEVAL is an agency enjoying technical and management autonomy, the regulates and coordinates the evaluation of national social development policy and of the specific policies, programs and actions carried out by public agencies. It is also in charge of defining, identifying and measuring poverty at the state and municipal levels. At all times, it must guarantee the accountability, rigor and objectivity of its activities. All the information produced regarding policy evaluation and poverty measurement is available at ( Contacto: Julieta Castro Toral Mario Pichardo Berriozabal Directora de Información y Comunicación Social Subdirector de Estrategias de Información y Difusión 01 (55) (55) jcastro@coneval.gob.mx mpichardo@coneval.gob.mx conevalvideo 7

8 8
9 9

10 10

11 11

12 Fuente: estimaciones del CONEVAL con base en el MCS-ENIGH 2010 y la muestra del Censo de Población y Vivienda
13 Fuente: estimaciones del CONEVAL con base en el MCS-ENIGH 2010 y la muestra del Censo de Población y Vivienda
CONEVAL PRESENTA LOS RESULTADOS DE LA MEDICIÓN DE POBREZA 2010 PARA CADA MUNICIPIO DEL PAÍS
 COMUNICADO DE PRENSA No. 015 Distrito Federal, 02 de diciembre de 2011 CONEVAL PRESENTA LOS RESULTADOS DE LA MEDICIÓN DE POBREZA 2010 PARA CADA MUNICIPIO DEL PAÍS Con la publicación de las estimaciones
Diciembre de 2011. www.coneval.gob.mx
 Diciembre de 2011 www.coneval.gob.mx Medición de la pobreza 2004 Ley General de Desarrollo Social Información del INEGI Indicadores Ingreso corriente per cápita Rezago educativo Acceso a servicios de salud
Measuring Poverty at the Municipal Level
 Measuring Poverty at the Municipal Level Graciela Teruel December 2012 www.coneval.gob.mx What for? Established by the General Law of Social Development National figures must be presented every two years.
Junio de
 Junio de 2013 www.coneval.gob.mx Construcción del grado de rezago social en entidades, municipios y localidades A partir de los indicadores que marca la Ley General de Desarrollo Social. Técnica estadística
PRESENTA CONEVAL ESTIMACIONES DEL ÍNDICE DE REZAGO SOCIAL 2010 A NIVEL MUNICIPAL Y POR LOCALIDAD
 COMUNICADO DE PRENSA No. 012 Distrito Federal, 04 de octubre de 2011 PRESENTA CONEVAL ESTIMACIONES DEL ÍNDICE DE REZAGO SOCIAL 2010 A NIVEL MUNICIPAL Y POR LOCALIDAD El Índice de Rezago Social incorpora
Participación Social en Guarderías
 Participación Social en s Localidad Esquema de AZCAPOTZALCO U 627 4 100.00 GUSTAVO A. MADERO U 715 6 100.00 GUSTAVO A. MADERO U 1402 7 100.00 GUSTAVO A. MADERO U 182 5 100.00 D.F. NORTE GUSTAVO A. MADERO
Participación Social en Guarderías
 Participación Social en s Resultados s visitas realizadas durante el mes de enero 2018 Localidad Esquema D.F. NORTE D.F. SUR AGUASCALIENTES BAJA CALIFORNIA NORTE BAJA CALIFORNIA SUR Padres Participantes
Participación Social en Guarderías
 Localidad Esquema BAJA CALIFORNIA NORTE de CUAUHTEMOC U 0788 6 GUSTAVO A. MADERO U 0182 7 98.57 MIGUEL HIDALGO U 1424 3 97.14 MIGUEL HIDALGO U 1444 3 MIGUEL HIDALGO U 1417 6 MIGUEL HIDALGO U 0629 6 97.14
Participación Social en Guarderías
 Participación Social en por 1 NOROESTE U 182 4 97.18 MIGUEL HIDALGO U 1444 7 CUAUHTEMOC U 704 7 90.00 D.F. Norte AZCAPOTZALCO U 627 7 CUAUHTEMOC U 703 5 MIGUEL HIDALGO U 625 7 98.42 VENUSTIANO CARRANZA
Participación Social en Guarderías
 Localidad Esquema Padres Participantes por Padres Participantes por D.F. NORTE GUSTAVO A. MADERO U 452 6 6 1 MAGDALENA CONTRERAS U 1245 4 98.57 BENITO JUAREZ U 1092 4 98.57 MIGUEL HIDALGO U 52 7 97.14
Participación Social en Guarderías
 Participación Social en D.F. Norte Localidad Esquema por por GUSTAVO A. MADERO U 626 7 100.00 AZCAPOTZALCO U 630 6 100.00 AZCAPOTZALCO U 786 7 95.71 GUSTAVO A. MADERO U 86 7 98.57 MIGUEL HIDALGO U 622
CONSECUTIVO CLAVE ENTIDAD
 CONSECUTIVO CLAVE ENTIDAD ENTIDAD CLAVE MUNICIPIO MUNICIPIO CLAVE POLÍGONO 1 01 Aguascalientes 01001 Aguascalientes 0100101_16 2 01 Aguascalientes 01001 Aguascalientes 0100102_16 3 02 Baja California 02002
Participación Social en Guarderías
 Participación Social en s Resultados s visitas realizadas durante el mes de abril 2018 Localidad Esquema D.F. NORTE D.F. SUR AGUASCALIENTES BAJA CALIFORNIA NORTE BAJA CALIFORNIA SUR Padres Participantes
Participación Social en Guarderías
 Localidad Esquema de AZCAPOTZALCO U 628 7 CUAUHTEMOC U 451 4 94.37 MIGUEL HIDALGO U 1424 3 98.57 D.F. NORTE MIGUEL HIDALGO U 181 6 MIGUEL HIDALGO U 629 7 41 8 98.57 98.58 GUSTAVO A. MADERO U 1350 7 GUSTAVO
II. Características sociales
 Características sociales II. Características sociales II.1 Porcentaje de población de 3 a 5 años que asiste a la escuela según sexo 52.3 52.0 52.6 Total Hombres Mujeres La educación constituye el motor
Participación Social en Guarderías
 Localidad Esquema por D.F. NORTE MIGUEL HIDALGO U 717 6 6 1 97.14 97.14 D.F. SUR AGUASCALIENTES BAJA CALIFORNIA NORTE BENITO JUAREZ U 741 4 98.57 8 BENITO JUAREZ U 1480 4 95.77 AGUASCALIENTES Y 16 3 7
La metodología actual
 www.coneval.gob.mx Un poco de historia Por muchas décadas no hubo medición oficial de pobreza en México. Entre 2001 y 2002, la Sedesol elaboró la primera medición oficial de pobreza a nivel nacional: Quien
Julio, 2018 COORDINACIÓN GENERAL DE PLANEACIÓN Y EVALUACIÓN
 Julio, 2018 COORDINACIÓN GENERAL DE PLANEACIÓN Y EVALUACIÓN LA MEDICIÓN DE LA POBREZA MEDICION DE LA POBREZA El CONEVAL mide la pobreza en forma multidimensional a partir de dos grandes espacios: Bienestar
Participación Social en Guarderías
 Localidad Esquema de D.F. NORTE AZCAPOTZALCO U 786 3 3 1 95.71 95.71 COYOACAN U 1479 7 98.57 MAGDALENA CONTRERAS U 1352 5 95.77 D.F. SUR AGUASCALIENTES BAJA CALIFORNIA NORTE BAJA CALIFORNIA SUR CAMPECHE
Participación Social en Guarderías
 Localidad Esquema D.F. NORTE D.F. SUR AGUASCALIENTES BAJA CALIFORNIA NORTE de CUAUHTEMOC U 702 4 GUSTAVO A. MADERO U 715 4 MIGUEL HIDALGO U 717 4 GUSTAVO A. MADERO U 1405 5 28 6 GUSTAVO A. MADERO U 698
MUNICIPIOS QUE RENOVARAN AUTORIDADES DURANTE EL 2018
 NO. PROG. DTO. CABECERA MUNICIPIO DURACIÓN 1. 9 IXTLÁN DE SAN BARTOLOMÉ ZOOGOCHO, VILLA ALTA, 2. 9 IXTLÁN DE SAN JUAN PETLAPA, CHOÁPAM, 3. 5 ASUNCIÓN NOCHIXTLÁN YODOHINO, HUAJUAPAN, 4. 5 ASUNCIÓN NOCHIXTLÁN
Participación Social en Guarderías
 Localidad Esquema de por CUAUHTEMOC U 624 4 GUSTAVO A. MADERO U 86 5 98.57 MIGUEL HIDALGO U 1444 4 MIGUEL HIDALGO U 1406 7 97.14 COYOACAN U 541 5 COYOACAN U 75 4 95.71 D.F. NORTE 20 4 98.93 COYOACAN U
Principales resultados de la medición de pobreza para Jalisco
 Principales resultados de la medición de pobreza para Jalisco 2008-2010 Consejo Estatal de Población Penitenciaría No.180, Col. Centro Tel 38-25-52-31 http://coepo.jalisco.gob.mx Septiembre 2011 V. 2 2
Participación Social en Guarderías
 Localidad Esquema D.F. NORTE de AZCAPOTZALCO U 0786 4 CUAUHTEMOC U 0704 4 98.59 CUAUHTEMOC U 0702 7 98.57 GUSTAVO A. MADERO U 0715 7 GUSTAVO A. MADERO U 0707 7 GUSTAVO A. MADERO U 0086 4 CUAUHTEMOC U 0619
Ingreso laboral per cápita por entidad federativa
 Ingreso laboral per cápita por entidad federativa Febrero 2015 www.coneval.gob.mx Ingreso laboral per cápita, Aguascalientes $2,300.0 $1,300.0 $1,200.0 2 Ingreso laboral per cápita, Baja California $3,600.0
INSTITUTO ESTATAL DE ACCESO A LA INFORMACION PÚBLICA UNIDAD DE ENLACE
 RELACION DE MUNICIPIOS INCORPORADOS AL SIEAIP EN 2011, A LOS CUALES SE LES HA CAPACITADO Y ENTREGADO SU CLAVE DE USUARIO Y CONTRASEÑA: N/P SUJETO OBLIGADO MUNICIPIO FECHA DE CAPACITACION Y CORREO ELECTRONICO
Regional Gross Domestic Product series Income accounts of the household sector series
 22 December 2017 Spanish Regional Accounts. Base 2010 Regional Gross Domestic Product. 2010-2016 series Income accounts of the household sector. 2010-2015 series Main results - Illes Balears was the Autonomous
El mapa de las drogas en México
 Notas de investigación EL COMERCIO DE DROGAS ILEGALES EN MÉXICO El mapa de las drogas en México Carlos Resa Nestares Los cien municipios con más narcos de México Posición Municipio Estado Tasa Población
Concentrado de cursos impartidos y población atendida a través de las Juntas Ejecutivas Locales y Distritales Enero-Junio, 2005.
 Educar para la Democracia AGUASCALIENTES 0 2 2 0 0 0 38 0 38 38 BAJA CALIFORNIA 5 4 9 47 89 0 0 47 89 136 CHIAPAS 1 0 1 13 11 0 0 13 11 24 CHIHUAHUA 1 7 8 37 54 277 287 314 341 655 COAHUILA 6 0 6 9 24
Participación Social en Guarderías
 Localidad Esquema D.F. NORTE D.F. SUR AGUASCALIENTES BAJA CALIFORNIA NORTE BAJA CALIFORNIA SUR de CUAUHTEMOC U 705 3 98.57 CUAUHTEMOC U 703 5 CUAUHTEMOC U 788 5 GUSTAVO A. MADERO U 452 5 98.57 GUSTAVO
CONSIDERACIONES PARA EL PROCESO PRESUPUESTARIO 2016
 CONSIDERACIONES PARA EL PROCESO PRESUPUESTARIO 2016 MAYO 2015 www.coneval.gob.mx 1 PRESUPUESTO QUE SE BASA EN RESULTADOS (PBR) El presupuesto de egresos de la federación que se aprueba cada año tiene un
Participación Social en Guarderías
 Localidad Esquema D.F. SUR AGUASCALIENTES BAJA CALIFORNIA NORTE Padres Participantes por Total de Padres Participantes por COYOACAN U 1479 7 COYOACAN U 0541 5 97.18 MAGDALENA CONTRERAS U 1352 4 98.59 TLALPAN
EL PODER ADQUISITIVO DEL INGRESO DE LOS HOGARES AUMENTÓ 8% ENTRE EL TERCER TRIMESTRE DE 2014 Y EL TERCER TRIMESTRE DE 2016
 COMUNICADO DE PRENSA No.008 24 de noviembre de 2016 EL PODER ADQUISITIVO DEL INGRESO DE LOS HOGARES AUMENTÓ 8% ENTRE EL TERCER TRIMESTRE DE 2014 Y EL TERCER TRIMESTRE DE 2016 Debido a que durante 2015
Indicadores de pobreza y rezago social en México. Noviembre 2011 International Seminar : Population Estimates and Projections.
 Indicadores de pobreza y rezago social en México Noviembre 2011 International Seminar : Population Estimates and Projections. 1 Presentación Consejo Nacional de Evaluación de la Política de Desarrollo
Anexo 1-III. Resultados por jurisdicción analizada
 Anexo 1-III. Resultados por jurisdicción analizada La siguiente sección describe, a través de una gráfica y una tabla, la situación específica de cada estado. En gris se marcan aquellas categorías cuya
Julio de 2011. www.coneval.gob.mx
 Julio de 2011 www.coneval.gob.mx 6.0 6.0 6 4 4.0 4.0 Acceso a la alimentación Millones de personas 4.1 Población con ingreso menor a la línea de bienestar 4.8 3.5 3.2 2008 10.6 % 11.7 millones 2010 10.4%
Reforestación urbana y rural (Número de árboles)
") 1993 Aguascalientes 611,000 78,000 689,000 Baja California 76,000 0 76,000 Baja California Sur 20,000 0 20,000 Campeche 489,000 2,653,000 3,142,000 Coahuila 442,000 300,000 742,000 Colima 120,000 0 120,000
1993 Aguascalientes 611,000 78,000 689,000 Baja California 76,000 0 76,000 Baja California Sur 20,000 0 20,000 Campeche 489,000 2,653,000 3,142,000 Coahuila 442,000 300,000 742,000 Colima 120,000 0 120,000
Spanish Regional Accounts. Base Regional Gross Domestic Product series Income accounts of the household sector.
 23 December 2015 Spanish Regional Accounts. Base 2010 Regional Gross Domestic Product. 2010-2014 series Income accounts of the household sector. 2010-2013 series Main results - La Rioja, Comunitat Valenciana
La violencia en los municipios de México. Ciudad de México, martes 26 de abril de 2016
 La violencia en los municipios de México 2015 Ciudad de México, martes 26 de abril de 2016 Índice de violencia en los municipios Posición Municipio Entidad Puntos 1 Acapulco de Juárez Guerrero 72.60 2
Censo de Población y Vivienda 2010 (INEGI)
") INSTITUTO PARA LA INTEGRACIÓN AL DESARROLLO DE LAS PERSONAS CON DISCAPACIDAD DEL DF Resumen estadístico: Personas con Discapacidad en México y el Distrito Federal Censo de Población y Vivienda 2010 (INEGI)
INSTITUTO PARA LA INTEGRACIÓN AL DESARROLLO DE LAS PERSONAS CON DISCAPACIDAD DEL DF Resumen estadístico: Personas con Discapacidad en México y el Distrito Federal Censo de Población y Vivienda 2010 (INEGI)
AUDITORÍA SUPERIOR DEL ESTADO SUBAUDITORÍA SUPERIOR DEL ESTADO A CARGO DE LA PLANEACIÓN Y NORMATIVIDAD TÉCNICA DIRECCIÓN DE SEGUIMIENTO Y EVALUACIÓN
 MUNICIPIOS QUE PRESENTARON DICTAMEN EN TIEMPO Y FORMA 1 18 CONCEPCION BUENAVISTA COIXTLAHUACA ENTREGA DICTAMEN Y ACTA ENTREGA-RECEPCIÓN 2 60 MIXISTLAN DE LA REFORMA MIXE ENTREGA DICTAMEN Y ACTA ENTREGA-RECEPCIÓN
Appendix F Data: Territorial Reserves Preliminary Assessment
 278 Revitalizing Cities: Improving Housing and Neighborhoods from Block to Metropolis Appendix F Data: Territorial Reserves Preliminary Assessment Appendix F presents an analysis of the composition of
CONEVAL INFORMA LA EVOLUCIÓN DE LA POBREZA
 COMUNICADO DE PRENSA No. 09 Ciudad de México 30 de agosto de 2017 CONEVAL INFORMA LA EVOLUCIÓN DE LA POBREZA 2010-2016 Esta información presenta la serie histórica que permite ver la evolución de la pobreza
Reporte de presupuesto asignado por entidad federativa, programa y tipo de intervención en la Salud. Ejercicio 2013
 Reporte de presupuesto asignado por entidad federativa, programa y tipo de intervención en la Salud. Ejercicio 2013 Filtros seleccionados para el reporte: Entidades federativas seleccionadas: Todas. Programas
Listado de los municipios que cuentan con certificación PROSARE a partir del 2014
 Listado de los municipios que cuentan con certificación PROSARE a partir del 2014 Estado Municipio Fecha de expedición 1. Aguascalientes Aguascalientes 15/10/2015 2. Baja California Ensenada 15/05/2017
PLAZAS VACANTES DEL SERVICIO PROFESIONAL ELECTORAL
 PLAZAS VACANTES DEL SERVICIO PROFESIONAL (FECHA DE CORTE AL 22 DE MAYO DE 2017) Con fundamento en lo dispuesto por los artículos 144 y 145 del Estatuto del Servicio Profesional Electoral Nacional y del
Población ocupada por entidad federativa y sector de actividad económica, datos censales 2000 y 2010
 2000 Aguascalientes Primario 24,392 7.37 Secundario 116,936 35.32 Terciario 181,334 54.77 No especificado 8,421 2.54 Total 331,083 100.00 Baja California Primario 57,558 6.35 Secundario 331,799 36.61 Terciario
Participación Social en Guarderías
 Localidad Esquema D.F. Sur AGUASCALIENTES BAJA CALIFORNIA NORTE ALVARO OBREGON U 1410 7 98.59 COYOACAN U 537 6 95.77 BENITO JUAREZ U 49 6 TLALPAN U 45 5 39 7 BENITO JUAREZ U 1480 3 XOCHIMILCO U 62 6 IZTAPALAPA
HOMICIDIOS Y CONDENADOS POR HOMICIDIO SEGÚN ESTADOS DE MÉXICO, CARLOS RESA NESTARES
 HOMICIDIOS Y CONDENADOS POR HOMICIDIO SEGÚN ESTADOS DE MÉXICO, 23-212 CARLOS RESA NESTARES TOTAL MÉXICO 3. 25. 2. 15. 1. 5. 23 24 25 26 27 28 29 21 211 212 Ratio condenas-homicidios 42% 45% 43% 41% 47%
EN 2008, 3.1 MILLONES DE ADULTOS MAYORES SE ENCONTRABAN EN POBREZA MULTIDIMENSIONAL
 Dirección de Información y Comunicación Social México, D.F. a 27 de agosto de 2010 Día del Adulto Mayor 28 de agosto EN 2008, 3.1 MILLONES DE ADULTOS MAYORES SE ENCONTRABAN EN POBREZA MULTIDIMENSIONAL
Aves para producción (Número de cabezas)
") Aguascalientes 1980 797,762 200,036 1981 834,247 204,079 1982 856,603 209,368 1983 863,564 211,487 1984 974,838 223,386 1985 1,006,913 249,491 1986 1,260,604 407,882 1987 1,752,193 357,069 1988 1,930,525
Aguascalientes 1980 797,762 200,036 1981 834,247 204,079 1982 856,603 209,368 1983 863,564 211,487 1984 974,838 223,386 1985 1,006,913 249,491 1986 1,260,604 407,882 1987 1,752,193 357,069 1988 1,930,525
DESCRIPTIVO DE LAS CINCO CIRCUNSCRIPCIONES PLURINOMINALES ELECTORALES FEDERALES EN QUE SE DIVIDE EL PAÍS
 ESTADOS UNIDOS MEXICANOS DESCRIPTIVO DE LAS CINCO CIRCUNSCRIPCIONES PLURINOMINALES ELECTORALES FEDERALES EN QUE SE DIVIDE EL PAÍS JULIO DE 2017 REGISTRO FEDERAL DE ELECTORES Página 1 de 10 DISTRIBUCIÓN
Encuesta Nacional de Victimización y Percepción sobre Seguridad Pública. ENVIPE 2013
 Encuesta Nacional de Victimización y Percepción sobre Seguridad Pública. ENVIPE 2013 Datos de Zacatecas y su comparabilidad Nacional Dirección del Sistema Estatal de Información. Octubre 2013 . Datos Zacatecas
Índice SHF de Precios de la Vivienda en México Base 2012 = 100*
 Índice SHF de Precios de la Vivienda en México Base 2012 = 100* Entidad Federativa ZMetropolitana 3 Clase 2 Tipo 2 2009 2010 2011 2012 2013 2016 I II III IV I II III IV I II III IV I II III IV I II III
EDUCACIÓN SUPERIOR ALUMNOS, DOCENTES Y ESCUELAS TOTAL Primera parte ENTIDAD
 TOTAL Primera parte TOTAL 1 TÉCNICO SUPERIOR FEDERATIVA Alumnos Hombres Mujeres Docentes* Escuelas** Instituciones** Alumnos Docentes Escuelas Aguascalientes 32 404 15 244 17 160 3 659 40 26 2 616 384
SECRETARIA DE RELACIONES EXTERIORES
 Jueves 14 de junio de DIARIO OFICIAL (Primera Sección) 41 SECRETARIA DE RELACIONES EXTERIORES ACUERDO por el que se dan a conocer los formatos, así como sus respectivos instructivos de llenado, que se
PROF. ELDA MAGDALENA LÓPEZ CASTRO PROF. EDGAR JUAN SAUCEDO ACOSTA Xalapa, Ver. Octubre 2014
 Desafíos de la Administración ante los Cambios Estructurales en el Contexto Global PROF. ELDA MAGDALENA LÓPEZ CASTRO PROF. EDGAR JUAN SAUCEDO ACOSTA Xalapa, Ver. Octubre 2014 Identificar los municipios
CONSULTA PÚBLICA SOBRE LA CAPTACIÓN DE LAS PRESTACIONES SOCIALES EN EL TRABAJO EN LA ENCUESTA NACIONAL DE INGRESOS Y GASTOS DE LOS HOGARES (ENIGH)
") CONSULTA PÚBLICA SOBRE LA CAPTACIÓN DE LAS PRESTACIONES SOCIALES EN EL TRABAJO EN LA ENCUESTA NACIONAL DE INGRESOS Y GASTOS DE LOS HOGARES (ENIGH) 2018 20 de diciembre de 2017 CONTEXTO La Ley General de
CONSULTA PÚBLICA SOBRE LA CAPTACIÓN DE LAS PRESTACIONES SOCIALES EN EL TRABAJO EN LA ENCUESTA NACIONAL DE INGRESOS Y GASTOS DE LOS HOGARES (ENIGH) 2018 20 de diciembre de 2017 CONTEXTO La Ley General de
Medición de la pobreza en México y en las Entidades Federativas 2016
 Medición de la pobreza en México y en las Entidades Federativas 2016 30 de agosto de 2017 www.coneval.org.mx CONTINUIDAD DE LA SERIE HISTÓRICA 2008-2016 INGRESO TOTAL PROMEDIO POR HOGAR, 2008 2016 (pesos
Indígenas. Indígenas. Página 1
 Indígenas Página 1 PRESIDENTA: Mtra. Elizabeth Bautista Velasco INTEGRANTES: Mtra. Nora Hilda Urdiales Sánchez. Lic. Uriel Pérez García. SESIÓN DE INSTALACIÓN: (20 de Noviembre de 2015) SESIÓN EXTRAORDINARIA:
Índice. Población Gráficas y mapas
 Índice Población Gráficas y mapas Gráfica 1 Mapa 1 Gráfica 2 Mapa 2 Gráfica 3 Mapa 3 Gráfica 4 Mapa 4 Gráfica 5 Mapa 5 Gráfica 6 Mapa 6 Gráfica 7 Mapa 7 Población total por entidad federativa Estratificación
Aseguramiento de especímenes de flora y fauna silvestre en riesgo (Número de especímenes)
") 2010 Aguascalientes 0 0 1 Baja California 0 0 0 Baja California Sur 1,151 1 12 Campeche 0 1 0 Coahuila 56 0 1 Colima 0 0 0 Chiapas 10 21 58 Chihuahua 104 13 3 Ciudad de México 175 24 192 Durango 81 0 4
2010 Aguascalientes 0 0 1 Baja California 0 0 0 Baja California Sur 1,151 1 12 Campeche 0 1 0 Coahuila 56 0 1 Colima 0 0 0 Chiapas 10 21 58 Chihuahua 104 13 3 Ciudad de México 175 24 192 Durango 81 0 4
Anexo Resultados principales del índice de intensidad migratoria México-Estados Unidos a nivel nacional
 Anexo A Resultados principales del índice de intensidad migratoria México-Estados Unidos a nivel nacional 45 Consejo Nacional de Población Mapa A.1. México: grado de intensidad migratoria a Estados Unidos
Informe de Evaluación de la Política de Desarrollo Social 2012
 Informe de Evaluación de la Política de Desarrollo Social 2012 Noviembre 2012 www.coneval.gob.mx AVANCES La política social ha tenido una mayor incidencia en la población con ingresos bajos, debido a programas
Informe de víctimas de homicidio, secuestro y extorsión
 Informe de víctimas de homicidio, secuestro y extorsión Corte Informativo: 17/07/ JULIO CENTRO NACIONAL DE INFORMACIÓN REPORTE MENSUAL DEL NÚMERO DE VÍCTIMAS DE HOMICIDIO, SECUESTRO Y EXTORSIÓN EN AVERIGUACIONES
INDICADORES SOCIODEMOGRÁFICOS
 INDICADORES SOCIODEMOGRÁFICOS DE LA POBLACIÓN INDIGENA 2000-2005 Septiembre, 2006 Nota: La información que aquí se presenta proviene de: CDI-PNUD. Sistema de indicadores sobre la población indígena de
del área metropolitana
 Perfil sociodemográfico del área metropolitana de Mpnierre XII Censo General de Población y Vivienda 2000 mum www.inegi.gob.mx XII Censo General de Población y Vivienda 2000 IN GI www.inegi.gob.mx r Perfil
Medición de la pobreza en México y en las Entidades Federativas 2016
 Medición de la pobreza en México y en las Entidades Federativas 2016 30 de agosto de 2017 www.coneval.org.mx CONTINUIDAD DE LA SERIE HISTÓRICA 2008-2016 INGRESO TOTAL PROMEDIO POR HOGAR, 2008 2016 (pesos
PLAZAS VACANTES DEL SERVICIO PROFESIONAL ELECTORAL
 PLAZAS VACANTES DEL SERVICIO PROFESIONAL (FECHA DE CORTE AL 16 DE FEBRERO DE 2016) Con fundamento en lo dispuesto por los artículos 65 y 66 del Estatuto del Servicio Profesional Electoral y del Personal
Título de la presentación Metodología de la Pobreza. Multidimensional
 Título de la presentación Metodología de la Pobreza Fecha 00/00/2016 Multidimensional Lunes 06 de junio de 2016 SEMINARIO DESIGUALDAD ECONÓMICA, POBREZA Y MOVILIDAD SOCIAL Sede donde se realizará la presentación
CHIAPAS. Estadísticas de trabajadores asegurados al IMSS. Enero Comité Estatal de Información Estadística y Geográfica de Chiapas
 CHIAPAS Estadísticas de trabajadores asegurados al IMSS. Enero 2013. Comité Estatal de Información Estadística y Geográfica de Chiapas Trabajadores asegurados al IMSS Chiapas Trabajadores Asegurados al
CONSEJO PARA EL DESARROLLO ECONÓMICO DE SINALOA (CODESIN). UNIDAD DE ANÁLISIS Y ESTADÍSTICA
. UNIDAD DE ANÁLISIS Y ESTADÍSTICA") CONSEJO PARA EL DESARROLLO ECONÓMICO DE SINALOA (CODESIN). UNIDAD DE ANÁLISIS Y ESTADÍSTICA REPORTE DE MEDICIÓN DE LA POBREZA EN SINALOA AL AÑO 2016. 2009. Conceptos: Boletín N0. 49/2017. Culiacán, Sin.
CONSEJO PARA EL DESARROLLO ECONÓMICO DE SINALOA (CODESIN). UNIDAD DE ANÁLISIS Y ESTADÍSTICA REPORTE DE MEDICIÓN DE LA POBREZA EN SINALOA AL AÑO 2016. 2009. Conceptos: Boletín N0. 49/2017. Culiacán, Sin.
Reporte sobre comercialización de la ZMVM
 Reporte sobre comercialización de la ZMVM Abril 2017 Contenido 1. Comparativo de ventas de 2017 vs 2016 por Estado, incluyendo Zona Metropolitana del Valle de México. 2. Comparativo de ventas de 2017 vs
SISTEMA NACIONAL DE BACHILLERATO
 SISTEMA NACIONAL DE BACHILLERATO PLANTELES CONALEP INCORPORADOS Fecha de corte: 2 de diciembre 2013. 1 Baja California Ensenada Incorporado en 2011 (Nivel III) 2 Baja California Ing. César Moreno Martínez
Los Mapas de la Pobreza en México. Julio 2007
 Los Mapas de la Pobreza en México Julio 2007 Presentación I. Marco Normativo II. III. IV. Mapas de Pobreza por Ingresos Multidimensionalidad de la Pobreza Mapas de Pobreza por Rezago Social, Localidades.
BITÁCORA DE VIVIENDA Compendio Estadístico del Sector
 Oferta de Vivienda Vigente por Segmento de Valor La Oferta Vigente de Vivienda en tiembre del 2012 fue de 308,674 a nivel nacional. El 75% de la oferta de vivienda corresponde a la vivienda en construcción,
SEXO. GÉNERO MARZO % GÉNERO MARZO % Masculino: Femenino:
 GÉNERO 8- GÉNERO 8- : 3 95 94 35.35 : 73 8 35 4.5 8-8- Solteros: 5 37 3.4 Solteras: 5 8.57 Casados: 57 3 7.9 Casadas: 59 38 39.9 No Especificó: 3.8 No Especificó:.34 3 95 94. 73 8 35. PROGRAMA DE VOLUNTAD
ROBO DE VEHÍCULOS ASEGURADOS Marzo 2011
 Miles de Vehículos Asegurados. ROBO DE VEHÍCULOS ASEGURADOS Marzo 211 Robo y recuperación de Vehículos Asegurados Anualizado (Abril - Marzo) 9 8 7 6 5 4 3 2 1 - Robo Recuperación 62 55 44 47 44 81 69 22
PLAZAS VACANTES DEL SERVICIO PROFESIONAL ELECTORAL
 PLAZAS VACANTES DEL SERVICIO PROFESIONAL (FECHA DE CORTE AL 11 DE ENERO DE 2017) Con fundamento en lo dispuesto por los artículos 144 y 145 del Estatuto del Servicio Profesional Electoral Nacional y del
CONTENIDO RESULTADOS FINALES DE ESTUDIO DE PROGRAMAS SOCIALES
 CONTENIDO CONTENIDO...2 INTRODUCCIÓN...3 RESULTADOS DE LA ENCUESTA...6 PERFIL SOCIO-DEMOGRÁFICO DE LA MUESTRA...39 CONCLUSIONES FINALES...47 METODOLOGÍA...49 ANEXO A. DISTRIBUCIÓN MUESTRAL POR MUNICIPIO...50
PLAZAS VACANTES DEL SERVICIO PROFESIONAL ELECTORAL
 PLAZAS VACANTES DEL SERVICIO PROFESIONAL (FECHA DE CORTE AL 15 DE MARZO DE 2017) Con fundamento en lo dispuesto por los artículos 144 y 145 del Estatuto del Servicio Profesional Electoral Nacional y del
XI. SALARIOS MÍNIMOS. Evolución del Salario Mínimo Real e Inflación
 XI. SALARIOS MÍNIMOS Evolución del Salario Mínimo Real e Inflación En los siete meses transcurridos del presente año, el salario mínimo general promedio acumuló un incremento de 5.55% en su poder adquisitivo;
PLAZAS VACANTES DEL SERVICIO PROFESIONAL ELECTORAL PLAZAS VACANTES EN ÓRGANOS DESCONCENTRADOS
 PLAZAS VACANTES DEL SERVICIO PROFESIONAL (FECHA DE CORTE AL 1 DE JUNIO DE 2016) Con fundamento en lo dispuesto por los artículos 144 y 145 del Estatuto del Servicio Profesional Electoral Nacional y del
CABECERAS DISTRITALES EN 210 DISTRITOS ELECTORALES FEDERALES UNINOMINALES EN LOS QUE SE LOCALIZA UNA SEDE DISTRITAL
 CABECERAS DISTRITALES EN 210 S ES FEDERALES UNINOMINALES EN LOS 1 AGUASCALIENTES C 5 JESÚS MARÍA 2 AGUASCALIENTES A 1 AGUASCALIENTES 3 AGUASCALIENTES B 1 AGUASCALIENTES 4 BAJA CALIFORNIA E 1 ENSENADA 5
Plantas de tratamiento de agua residual industrial
 Aguascalientes 1996 19 47.50 47.50 1997 19 47.50 47.50 1998 21 144.30 49.87 1999 25 144.30 49.87 2000 24 196.00 69.97 2001 24 197.70 69.97 2002 24 198.00 70.00 2003 24 198.00 70.00 2004 24 198.00 90.00
SECRETARÍA DE HACIENDA TARIFA DE VIÁTICOS PARA LAS DEPENDENCIAS DEL PODER EJECUTIVO POR GRUPOS JERÁRQUICOS Y ZONIFICACIÓN: APÉNDICE No 1
 DE VIÁTICOS PARA LAS DEPENDENCIAS DEL PODER EJECUTIVO : APÉNDICE No 1 Zona I /LOCALIDAD TODOS LOS NIVELES AHUMADA $ 660.00 $ 165.00 TODOS LOS NIVELES ALDAMA $ 660.00 $ 165.00 TODOS LOS NIVELES ALLENDE
Índice Hogares Gráficas y mapas Cuadros con datos básicos
 Índice Hogares Gráficas y mapas Gráfica 29 Porcentaje de población en hogares familiares nucleares, por entidad federativa Mapa 29 Estratificación de las entidades según porcentaje de población en hogares
FECHA DE ENTREGA. DON/RT/AGA/TGZ/DEBM/367/11/03 15-mar D50. DON/RT/AGA/TGZ/DEBM/385/11/03 15-mar ,200 D50
 Enero - Diciembre 20 FUNDACION TV AZTECA, AC, DISTRITO FEDERAL (acotada a 2 de los 50 Municipios de Más Alta Marginalidad nacional) CHIAPAS SAN JUAN DEL RIO, QUERETARO DEL NAYAR, NAYARIT SONORA DON/RT/AGA/CEN/DEBM/357//0
Informe de víctimas de homicidio, secuestro y extorsión
 Informe de víctimas de homicidio, secuestro y extorsión *Para el delito de extorsión, algunas entidades reportan más averiguaciones previas que víctimas debido a la logística de registro y seguimiento
Auditorias ambientales a industrias según sector (Número de auditorías)
") 1992 Nacional - - 78 1992-1997 Aguascalientes - - 14 Baja California - - 37 Baja California Sur - - 7 Campeche - - 5 Coahuila - - 59 Colima - - 9 Chiapas - - 11 Chihuahua - - 68 Durango - - 19 Guanajuato
1992 Nacional - - 78 1992-1997 Aguascalientes - - 14 Baja California - - 37 Baja California Sur - - 7 Campeche - - 5 Coahuila - - 59 Colima - - 9 Chiapas - - 11 Chihuahua - - 68 Durango - - 19 Guanajuato
Instituto de Estadísticas de Puerto Rico Estado Libre Asociado de Puerto Rico
 Instituto de Estadísticas de Puerto Rico Estado Libre Asociado de Puerto Rico COMUNICADO DE PRENSA RED STATE DATA CENTER DE PUERTO RICO 26 de junio de 2014 TRECE MUNICIPIOS REGISTRAN UNA EDAD MEDIANA DE
DIRECCIÓN GENERAL DEL SISTEMA NACIONAL DE INFORMACIÓN SOBRE SEGURIDAD PÚBLICA DIRECCIÓN DEL REGISTRO PÚBLICO VEHICULAR
 AGUASCALIENTES Av. Convención Ote. 102 Col. del Trabajo C.P. 20180 Aguascalientes, Ags. BAJA CALIFORNIA Edif. Poder Ejecutivo 4to piso Calzada Independencia N 994 y Paseo de los Héroes Centro Cívico C.P.
INSTITUTO NACIONAL DE ESTADÍSTICA Y GEOGRAFÍA. Encuesta Nacional de la Dinámica Demográfica Poblaciones de control
 INSTITUTO NACIONAL DE ESTADÍSTICA Y GEOGRAFÍA Encuesta Nacional de la Dinámica Demográfica 2009 Poblaciones de control DR 2010, Instituto Nacional de Estadística y Geografía Edifi cio Sede Av. Héroe de
GERENCIA DE RESPONSABILIDAD Y DESARROLLO SOCIAL
 Estado Beneficiario Ficha Magna Litros 1 Aguascalientes Municipio de Aguascalientes GRDS/DE/052/2015 DG/CE/0062/2015 30/07/2015 07/08/2015 200 1,896,978 20,000 251,855 20,000 263,305 - - - - 100 2 Baja