COVER PHOTOGRAPH BY WAYNE PERRYMAN FOTOGRAFÍA EN LA PORTADA POR WAYNE PERRYMAN
|
|
|
- Julio Giménez Rey
- hace 5 años
- Vistas:
Transcripción
1
2 COVER PHOTOGRAPH BY WAYNE PERRYMAN FOTOGRAFÍA EN LA PORTADA POR WAYNE PERRYMAN
3 INTER-AMERICAN TROPICAL TUNA COMMISSION COMISIÓN INTERAMERICANA DEL ATÚN TROPICAL Fishery Status Report Informe de la Situación de la Pesquería No. 3 TUNAS AND BILLFISHES IN THE EASTERN PACIFIC OCEAN IN 2004 LOS ATUNES Y PECES PICUDOS EN EL OCÉANO PACÍFICO ORIENTAL EN 2004 La Jolla, California 2005
4
5 3 FISHERY STATUS REPORT 3 TUNAS AND BILLFISHES IN THE EASTERN PACIFIC OCEAN IN 2004 A. The fishery for tunas and billfishes in the eastern Pacific Ocean...7 B. Yellowfin tuna...62 C. Skipjack tuna...70 D. Bigeye tuna...74 E. Pacific bluefin tuna...84 F. Albacore tuna...87 G. Swordfish...91 H. Blue marlin...94 I. Striped marlin...96 J. Ecosystem considerations...99 INTRODUCTION This report provides a summary of the fishery for tunas in the eastern Pacific Ocean (EPO), an assessment of the stocks of tunas and billfishes that are exploited in the fishery, and an evaluation of the pelagic ecosystem in the EPO. The report is based on data available to the IATTC staff in March Section E (Pacific bluefin tuna) and the three sections on billfishes (G, H, I) are the same as the corresponding sections of IATTC Fishery Status Report 2, published in 2004, except for minor changes in the text and updates of the figures. All weights of catches and discards are in metric tons (t). In the tables, 0 means no effort or catch <1 metric ton; blank means no data collected; * means data missing or not available. The following abbreviations are used: Species: ALB Albacore tuna (Thunnus alalunga) Flags: BLZ Belize BET Bigeye tuna (Thunnus obesus) BOL Bolivia BIL Unidentified Istiophorid billfishes CAN Canada BKJ Black skipjack (Euthynnus lineatus) CHN China BLM Black marlin (Makaira indica) COL Colombia BUM Blue marlin (Makaira nigricans) CRI Costa Rica BZX Bonito (Sarda spp.) ECU Ecuador CAR Chondrichthyes, cartilaginous fishes nei 1 ESP Spain CGX Carangids (Carangidae) GTM Guatemala DOX Dorado (Coryphaena spp.) HND Honduras MLS Striped marlin (Tetrapturus audax) JPN Japan MZZ Osteichthyes, marine fishes nei KOR Republic of Korea PBF Pacific bluefin tuna (Thunnus orientalis) MEX Mexico SFA Indo-Pacific sailfish (Istiophorus platypterus) NIC Nicaragua SKJ Skipjack tuna (Katsuwonus pelamis) PAN Panama SKX Unidentified elasmobranchs PER Peru SSP Shortbill spearfish (Tetrapturus angustirostris) PYF French Polynesia SWO Swordfish (Xiphias gladius) SLV El Salvador TUN Unidentified tunas TWN Chinese Taipei YFT Yellowfin tuna (Thunnus albacares) UNK Unknown USA United States of America VEN Venezuela VUT Vanuatu 1 not elsewhere included
6 4 Fishing gears: FPN Trap GN Gillnet HAR Harpoon LL Longline LP Pole-and-line LTL Troll OTR Other 2 NK Unknown PS Purse seine RG Recreational TX Trawl Ocean areas: EPO Eastern Pacific Ocean WCPO Western and Central Pacific Ocean Set types: DEL Dolphin NOA Unassociated school OBJ Floating object FLT: Flotsam FAD: Fish-aggregating device Stock assessment: AMSY Average maximum sustainable yield B Biomass C Catch CPUE Catch per unit of effort F Coefficient of fishing mortality SBR Spawning biomass ratio SSB Spawning stock biomass 2 Used to group known gear types
7 5 INFORME DE LA SITUACIÓN DE LA PESQUERÍA 3 LOS ATUNES Y PECES PICUDOS EN EL OCÉANO PACÍFICO ORIENTAL EN 2004 A. La pesquería de atunes y peces picudos en el Océano Pacífico oriental...54 B. Atún aleta amarilla...68 C. Atún barrilete...73 D. Atún patudo...82 E. Atún aleta azul del Pacífico...86 F. Atún albacora...90 G. Pez espada...93 H. Marlín azul...95 I. Marlín rayado...98 J. Consideraciones de ecosistema INTRODUCCIÓN El presente informe contiene un resumen de la pesquería de atunes en el Océano Pacífico oriental (OPO), una evaluación de las poblaciones de atunes y peces picudos que son explotadas en la pesquería, y una evaluación del ecosistema pelágico en el OPO. El informe basa en datos disponibles al personal de la CIAT en marzo de La Sección E (atún aleta azul del Pacífico), y las tres secciones sobre peces picudos (G, H, I), son iguales a las secciones correspondientes del Informe de la Situación de la Pesquería 2, publicado en 2004, salvo unos ligeros cambios en el texto y actualizaciones de las figuras. Se expresa el peso de capturas y descartes en toneladas métricas (t). En las tablas, 0 en una casilla significa ningún esfuerzo o una captura de menos de 1 tonelada métrica, una casilla en blanco significa que no se tomaron datos, y * significa datos faltantes o no disponibles. Se usan las abreviaturas siguientes: Especies: Banderas: ALB Atún albacora (Thunnus alalunga) BLZ Belice BET Atún patudo (Thunnus obesus) BOL Bolivia BIL Peces picudos Istiofóridos no identificados CAN Canadá BKJ Atún barrilete negro (Euthynnus lineatus) CHN China BLM Marlín negro (Makaira indica) COL Colombia BUM Marlín azul (Makaira nigricans) CRI Costa Rica BZX Bonito (Sarda spp.) ECU Ecuador CAR Chondrichthyes, peces cartilaginosos nep 3 ESP España CGX Carángidos (Carangidae) GTM Guatemala DOX Dorados (Coryphaena spp.) HND Honduras MLS Marlín rayado (Tetrapturus audax) JPN Japón MZZ Osteichthyes, peces marinos nep KOR República de Corea PBF Atún aleta azul del Pacífico (Thunnus orientalis) MEX México SFA Pez vela del Indo-Pacífico (Istiophorus platypterus) NIC PAN Nicaragua Panamá SKJ Atún barrilete (Katsuwonus pelamis) PER Perú SKX Elasmobranquios no identificados PYF Polinesia Francesa SSP Marlín trompa corta (Tetrapturus angustirostris) SLV El Salvador SWO Pez espada (Xiphias gladius) TWN Taipei Chino TUN Atunes no identificados UNK Desconocido YFT Atún aleta amarilla (Thunnus albacares) USA Estados Unidos de América VEN Venezuela VUT Vanuatu 3 no especificado en otra partida
8 6 Artes de pesca: FPN Almadraba GN Red de transmalle HAR Arpón LL Palangre LP Caña LTL Curricán OTR Otras 4 NK Desconocido PS Red de cerco RG Deportivo TX Red de arrastre Áreas oceánicas: EPO Océano Pacífico oriental WCPO Océano Pacífico occidental y central Tipos de lance: DEL Delfín NOA Peces no asociados OBJ Objeto flotante FLT: Natural FAD: Plantado Evaluación de poblaciones: B Biomasa C Captura CPUE Captura por unidad de esfuerzo F Coeficiente de mortalidad por pesca RMSP Rendimiento máximo sostenible promedio SBR Cociente de la biomasa reproductora SSB Biomasa de la población reproductora 4 Usado para agrupar artes conocidas
9 7 A. THE FISHERY FOR TUNAS AND BILLFISHES IN THE EASTERN PACIFIC OCEAN 1. Catches and landings of tunas, billfishes, and associated species Catches by species Distributions of the catches of tunas Size compositions of the catches of tunas Catches of tunas and bonitos, by flag and gear Landings of tunas and bonitos by purse-seine and pole-and-line vessels Purse-seine catches per cubic meter of well volume Effort Purse seine Longline The fleets The purse-seine and pole-and-line fleets Other fleets of the EPO...14 This section summarizes the fisheries for species covered by the IATTC Convention (tunas and other fish caught by tuna-fishing vessels) in the eastern Pacific Ocean (EPO). The most important of these are the scombrids (Family Scombridae), which include tunas, bonitos, seerfishes, and mackerels. The principal species of tunas caught are yellowfin, skipjack, bigeye, and albacore, with lesser catches of Pacific bluefin, black skipjack, and frigate and bullet tunas; other scombrids, such as bonitos and wahoo, are also caught. This report also covers other species caught by tuna-fishing vessels in the EPO: billfishes (swordfish, marlins, shortbill spearfish, and sailfish) carangids (yellowtail, rainbow runner, and jack mackerel), dorado, elasmobranchs (sharks, rays, and skates), and other fishes. Most of the catches are made by the purse-seine and longline fleets; the pole-and-line fleet and various artisanal and recreational fisheries account for a small percentage of the total catches. Detailed data are available for the purse-seine and pole-and-line fisheries; the data for the longline, artisanal, and recreational fisheries are less complete. The IATTC Regional Vessel Register contains details of vessels authorized to fish for tunas in the EPO. The IATTC has detailed records of most of the purse-seine and pole-and-line vessels that fish for yellowfin, skipjack, bigeye, and/or Pacific bluefin tuna in the EPO. The Register is incomplete for small vessels. It contains records for large (>24 m) longline vessels of some nations that fish in the EPO and in other areas. Purse-seine vessels are grouped into six size classes, by carrying capacity in cubic meters (m 3 ) of well volume, as follows: Class Volume (m 3 ) < >425 The data in this report are derived from various sources, including vessel logbooks, observer data, unloading records provided by canners and other processors, export and import records, estimates derived from the species and size composition sampling program, reports from governments and other entities, and published reports. 1. CATCHES AND LANDINGS OF TUNAS, BILLFISHES, AND ASSOCIATED SPECIES Estimating the total catch of a species of fish is difficult, for various reasons. Some fish are discarded at sea, and the data for some gear types are often incomplete. Data for fish discarded at sea by Class-6 purse-seine vessels have been collected by observers since This information allows for better estimation of the total amounts of fish caught by the purse-seine fleet. Estimates of the total amount of the catch that is landed (hereafter referred to as the retained catch) are based principally on data from unloadings. Beginning with this report, the unloading data for purse-seine and pole-and-line vessels have been adjusted, based on the species composition estimates for yellowfin, skipjack, and bigeye tunas. The current species composition sampling program, described in Section 1.3.1, began in 2000, so the catch data for are adjusted, based on estimates obtained for each year, by flag. The catch data for the previous years were adjusted by applying the average ratio by species from the estimates, by flag, and summing over all flags. This has tended to increase the estimated catches of bigeye and decrease those of yellowfin and/or skipjack. These adjustments are all preliminary, and may be improved in the future. All of the purse-seine and pole-and-line data for 2004 are preliminary. Data on the retained catches of most of the larger longline vessels are obtained from the governments of the nations that fish for tunas in the EPO. Longline vessels, particularly the larger ones, direct their effort primarily at bigeye, yellowfin, albacore, or swordfish. Data from
10 8 smaller longliners, artisanal vessels, and other vessels that fish for tunas, billfishes, dorado, and sharks in the EPO were gathered either directly from the governments, from logbooks, or from reports published by the governments. Data for the western and central Pacific Ocean (WCPO) were provided by the Ocean Fisheries Programme of the Secretariat of the Pacific Community (SPC). All data for longlines and other gears for 2003 and 2004 are preliminary. The data from all of the above sources are compiled in a database by the IATTC staff and summarized in this report. In recent years, the IATTC staff has increased its effort toward compiling data on the catches of tunas, billfishes, and other species caught by other gear types, such as trollers, harpooners, gillnetters, and recreational vessels. The estimated total catches from all sources mentioned above of yellowfin, skipjack, and bigeye in the entire Pacific Ocean are shown in Table A-1, and are discussed further in the sections below. Estimates of the annual retained and discarded catches of tunas and other species taken by tuna-fishing vessels in the EPO during are shown in Table A-2. The catches of tunas and bonitos by all gears during , by gear and flag, are shown in Tables A-3ae, and the purse-seine and pole-and-line catches and landings of tunas and bonitos during are summarized by flag in Tables A- 4a-b. There were no restrictions on fishing for tunas in the EPO during , but the catches of most species have been affected by restrictions on fishing during some or all of the last six months of Furthermore, regulations placed on purse-seine vessels directing their effort at tunas associated with dolphins have affected the way these vessels operate, especially since the late 1980s, as discussed in Section 3. The catches have also been affected by climate perturbations, such as the major El Niño events that occurred during and These events made the fish less vulnerable to capture by purse seiners due to the greater depth of the thermocline, but had no apparent effect on the longline catches. Yellowfin recruitment tends to be greater after an El Niño event. The effects of El Niño events and other environmental conditions on the fisheries of the EPO are discussed further in Section J.5, Physical environment Catches by species Yellowfin tuna The annual catches of yellowfin during are shown in Table A-1 and Figure B-1. Overall, the catches in both the EPO and WCPO have increased during this period. In the EPO, the El Niño event of led to a reduction in the catches in those years, whereas catches in the WCPO were apparently not affected. Although the El Niño episode of was greater in scope, it did not have the same effect on the yellowfin catches in the EPO. In the WCPO, the catches of yellowfin reached 350 thousand metric tons (t) in 1990, peaked at 466 thousand t in 1998, and remained high through 2003 (2004 data for the WCPO are not yet available). The catches throughout the Pacific Ocean were high during In the EPO, the catch of yellowfin in 2002, 440 thousand t, was the greatest on record, but in 2004 it decreased substantially. The annual retained catches of yellowfin in the EPO by purse-seine and pole-and-line vessels during are shown in Table A-2a. The average annual retained catch during was 276 thousand t (range: 212 to 413 thousand t). The preliminary estimate of the retained catch in 2004, 270 thousand t, was 29% less than in 2003, and 2% less than the average for The average amount of yellowfin discarded at sea during was about 2% of the total purse-seine catch (retained catch plus discards) of yellowfin (range: 1 to 3%) (Table A-2a). The annual retained catches of yellowfin in the EPO by longliners during are shown in Table A-2a. During they remained relatively stable, averaging about 22 thousand t (range: 11 to 35 thousand t), or about 7% of the total retained catches of yellowfin. Yellowfin are also caught by recreational vessels, as incidental catch in gillnets, and by artisanal fisheries. Estimates of these catches are shown in Table A-2a, under Other gears (OTR); during they averaged about 2 thousand t. Further information on yellowfin tuna is presented in Section B of this report Skipjack tuna The annual catches of skipjack during are shown in Table A-1 and Figure C-1. Most of the skipjack catch in the Pacific is taken in the WCPO. The greatest reported catch in the WCPO, 1.3 million t, occurred in 1998, while the greatest reported catch in the EPO, 296 thousand t, occurred in The annual retained catches of skipjack in the EPO by purse-seine and pole-and-line vessels during are shown in Table A-2a. During the annual retained catch averaged 138 thousand t (range 64 to 276 thousand t). The preliminary estimate of the retained catch in 2004, 197 thousand t, is 43% greater than the average for , but 28% less than the record-high catch of The average amount of skipjack discarded at sea during was about 11% of the total catch of skipjack (range: 7 to 19%) (Table A-2a).
11 Small amounts of skipjack are caught with longlines and other gears (Table A-2a). Further information on skipjack tuna is presented in Section C of this report Bigeye tuna The annual catches of bigeye during are shown in Table A-1 and Figure D-1. Overall, the catches in both the EPO and WCPO have increased, but with considerable fluctuation. The catches in the EPO reached 100 thousand t in 1986, and have fluctuated between about 70 and 125 thousand t since then, with the greatest reported catch in In the WCPO the catches of bigeye increased to more than 85 thousand t during the late 1970s, decreased during the 1980s, and then increased, with lesser fluctuations, until 1999, when the catches reached more than 110 thousand t. The greatest reported catch of bigeye in the WCPO, about 115 thousand t, occurred in Prior to 1994, the average annual retained catch of bigeye taken by purse-seine vessels in the EPO was about 9 thousand t (range 1 to 22 thousand t) (Table A-2a). Following the development of fish-aggregating devices (FADs), placed in the water by fishermen to aggregate tunas, the annual retained catches of bigeye increased from 35 thousand t in 1994 to 44 to 64 thousand t during , to a record high of 94 thousand t in A preliminary estimate of the retained catch in the EPO in 2004 is 67 thousand t. The average amount of bigeye discarded at sea during was about 5% of the purse-seine catch of bigeye (range: 1 to 9%). Small amounts of bigeye have been caught by pole-and-line vessels, as shown in Table A-2a. During , prior to the increased use of FADs and the resulting greater catches of bigeye by purse-seine vessels, the longline fisheries accounted for about 88%, on average, of the retained catches of this species from the EPO. During the annual retained catches of bigeye by the longline fisheries ranged from about 36 to 73 thousand t (average: 56 thousand t), or an average of 48% of the total catch of bigeye in the EPO (Table A-2a). The preliminary estimate of the catch in the EPO in 2004 is 40 thousand t (Table A-2a). Small amounts of bigeye are caught by other gears, as shown in Table A-2a. Further information on bigeye tuna is presented in Section D of this report Bluefin tuna The catches of Pacific bluefin in the entire Pacific Ocean, by flag and gear, are shown in Table A-5 and Figure E-1. The data, which were obtained from the International Scientific Committee for Tuna and Tuna-like Species in the North Pacific Ocean (ISC), are reported by fishing nation or entity, regardless of the area of the Pacific Ocean in which the fish were caught. The catches of Pacific bluefin in the EPO during , by gear, are shown in Table A-2. During the annual retained catch of bluefin from the EPO by purse-seine and pole-and-line vessels averaged 2 thousand t (range 400 t to 8 thousand t). The preliminary estimate of the retained catch of bluefin in 2004, 9 thousand t, is four times the average for Small amounts of bluefin are discarded at sea by purse-seine vessels (Table A-2a). Further information on Pacific bluefin tuna is presented in Section E of this report Albacore tuna The catches of albacore in the entire Pacific Ocean, by gear and area (north and south of the equator and east and west of 150 W) are shown in Tables A-6a-b, and the catches north and south of the equator (but not east and west of 150 W) are shown in Figures F-1a-b. The catches of albacore in the EPO, by gear, are shown in Table A-2a. A significant portion of the albacore catch is taken by troll gear, included under Other gears (OTR) in Table A-2a. The catch data were obtained from IATTC data for the EPO and from data compiled by the SPC for the WCPO. Further information on albacore tuna is presented in Section F of this report Other tunas and tuna-like species While yellowfin, skipjack, and bigeye tunas comprise the most significant portion of the retained catches of the purse-seine and pole-andline fleets in the EPO, other tunas and tuna-like species, such as black skipjack, bonito, wahoo, and frigate and bullet tunas, contribute to the overall harvest in this area. The estimated annual retained and discarded catches of these species during are presented in Table A-2a. The catches reported in the unidentified tunas category (TUN) in Table A-2a contain some catches reported by species (frigate or bullet tunas, wahoo) along with the unidentified tunas. The total retained catch of these other species by these fisheries was about 1 thousand t in 2004, which is less than the annual average retained catch of about 4 thousand t (range: 1 to 15 thousand t). Black skipjack are also caught by other gears in the EPO, mostly by coastal artisanal fisheries. Bonitos are also caught by artisanal fisheries, and have been reported as catch by longline vessels in some years. 9
12 Billfishes Catch data for billfishes (swordfish, blue marlin, black marlin, striped marlin, shortbill spearfish, and sailfish) are shown in Table A-2b and in Figures G-1, H-1, and I-1. Swordfish are caught in the EPO with large-scale and artisanal longline gear, gillnets, harpoons, and occasionally with recreational gear. The average annual longline catch of swordfish during was 9 thousand t, but during was over 15 thousand t. It is not clear whether this is due to increasing effort directed toward swordfish. Other billfishes are caught with large-scale and artisanal longline gear and recreational gear. The average annual longline catches of blue marlin and striped marlin during were about 5 thousand and 3 thousand t, respectively. Smaller amounts of other billfishes are taken by longline. Unfortunately, little information is available on the recreational catches of billfishes, but they are believed to be substantially less than the commercial catches for all species. Small amounts of billfishes are caught by purse seiners, but these are considered discarded, although some may be landed but not reported. These data are also included in Table A-2b. Further information on swordfish, blue marlin, and striped marlin is presented in Sections G-I of this report Other species Data on the catches and discards of carangids (yellowtail, rainbow runner, and jack mackerel), dorado, elasmobranchs (sharks, rays, and skates), and other fishes caught in the EPO are shown in Table A-2c. Dorado are unloaded mainly in ports in South and Central America. Although the catches are greater than 10 thousand t in some years, the gear types used are often not reported Distributions of the catches of tunas Purse-seine catches The average annual distributions of the catches of yellowfin, skipjack, and bigeye, by set type, for purse-seine in the EPO during ( for bigeye), are shown in Figures A-1a, A-2a, and A-3a, and preliminary estimates for 2004 are shown in Figures A-1b, A-2b, and A-3b. The catches of yellowfin were significantly less in the northern areas off Mexico and Central America in The distribution of the skipjack catches in 2004 were similar to those of , although the catches in the nearshore areas off Mexico were greater, possibly due to changes in fishing strategy due to the poor yellowfin fishing. Bigeye are not often caught north of about 7 N. The catches of bigeye were reduced in the nearshore areas off South America in With the development of the fishery for tunas associated with FADs, described above, the relative importance of the nearshore areas has decreased, while that of the offshore areas has increased Longline catches Data on the spatial and temporal distributions of the catches in the EPO by the distant-water longline fleets of China, Chinese Taipei, French Polynesia, Japan, the Republic of Korea, Spain, the United States, and Vanuatu are maintained in databases of the IATTC. Bigeye and yellowfin tunas make up the majority of the catches by most of these vessels. The distributions of the catches of bigeye and yellowfin tunas in the Pacific Ocean by the Japanese longline fleet during are shown in Figure A-4. Data for the Japanese longline fishery in the EPO during is available in IATTC Bulletins describing that fishery Size compositions of the catches of tunas Purse-seine, pole-and-line, and recreational fisheries Length-frequency samples are the basic source of data used for estimating the size and age compositions of the various species of fish in the landings. This information is necessary to obtain age-structured estimates of the populations for various purposes, including the integrated modeling that the staff has employed during the last several years. The results of such studies have been described in several IATTC Bulletins, in all of its Annual Reports since that for 1954, and in its Stock Assessment Reports. Length-frequency samples of yellowfin, skipjack, bigeye, Pacific bluefin, and, occasionally, black skipjack from the catches of purse-seine, pole-and-line, and recreational vessels in the EPO are collected by IATTC personnel at ports of landing in Ecuador, Mexico, Panama, the USA, and Venezuela. The catches of yellowfin and skipjack were first sampled in 1954, bluefin in 1973, and bigeye in Sampling has continued to the present.
13 The methods for sampling the catches of tunas are described in the IATTC Annual Report for 2000 and in IATTC Stock Assessment Report 4. Briefly, the fish in a well of a purse-seine or pole-and-line vessel are selected for sampling only if all the fish in the well were caught during the same calendar month, in the same type of set (floating-object, unassociated school, or dolphin), and in the same sampling area. These data are then categorized by fishery (Figure A-5), based on the staff s most recent stock assessments. Data for fish caught during the period are presented in this report. Two sets of length-frequency histograms are presented for each species, except bluefin; the first shows the data by stratum (gear type, set type, and area) for 2004, and the second shows the combined data for each year of the period. For bluefin, the histograms show the catches by commercial and recreational gear combined. Samples from 496 wells (including 10 from recreational vessels) were taken during Only a small amount of catch was taken by pole-and-line vessels in 2004, and only one sample was obtained from these vessels. For stock assessments of yellowfin, nine purse-seine fisheries (four associated with floating objects, three associated with dolphins, and two unassociated school) and one pole-and-line fishery are defined (Figure A-5). The last fishery includes all 13 sampling areas. Of the 496 wells sampled, 379 contained yellowfin. The estimated size compositions of the fish caught during 2004 are shown in Figure A-6a. The majority of the yellowfin catch was taken by sets on schools associated with dolphins. The larger yellowfin (>100 cm) were caught mostly during the first half of 2004, while those <100 cm were caught mostly during the second half of that year. However, a mode of smaller yellowfin (<60 cm) was evident in the Southern unassociated fishery during the second quarter. These smaller fish were also present in the Northern unassociated fishery and in all of the floating-object fisheries. Small amounts of yellowfin were caught in the floating-object fisheries throughout the year. The catches by pole-and-line vessels were negligible. The estimated size compositions of the yellowfin caught by all fisheries combined during are shown in Figure A-6b. The average weights of the yellowfin caught in 2004 were the lowest since The majority of yellowfin >10 kg in weight were caught during the first half of The mode between 80 and 100 cm was the most prevalent size group during all of the quarters except the second. For stock assessments of skipjack, seven purse-seine fisheries (four associated with floating objects, two unassociated school, one associated with dolphins) and one pole-and-line fishery are defined (Figure A-5). The last two fisheries include all 13 sampling areas. Of the 496 wells sampled, 328 contained skipjack. The estimated size compositions of the fish caught during 2004 are shown in Figure A-7a. The majority of the skipjack catch during the first half of 2004 was taken in unassociated and floating-object sets in the Southern area. During the second quarter, however, the catches of skipjack increased in the Northern area. During the third quarter, the majority of skipjack were caught in the Northern area, although the catches increased in the Equatorial floating-object fishery as well. The catches of skipjack in the latter fishery continued to increase during the fourth quarter, and fish were also caught again in the two Southern fisheries. The three modes of fish evident in the Northern unassociated fishery were caught in three different quarters: the largest fish in the third quarter, the smallest fish in the fourth quarter, and the medium-sized fish in the second quarter. The skipjack caught in the fishery for schools associated with dolphins were taken mostly during the second quarter. Negligible amounts of skipjack were caught by pole-andline vessels. The estimated size compositions of the skipjack caught by all fisheries combined during are shown in Figure A-7b. The smaller fish (40 to 50 cm) were caught primarily during the first and fourth quarters of 2004, and the larger ones (>55 cm) primarily during the second quarter that year. For stock assessments of bigeye, six purse-seine fisheries (four associated with floating objects, one unassociated school, one associated with dolphins) and one pole-and-line fishery are defined (Figure A-5). The last three fisheries include all 13 sampling areas. Of the 496 wells sampled, 118 contained bigeye. The estimated size compositions of the fish caught during 2004 are shown in Figure A-8a. In 2000 the majority of the catch was taken in floating-object sets in the Equatorial area, whereas from 2001 to 2003 the majority of the bigeye catch was taken in sets on floating objects in the Southern area. In 2004 nearly equal amounts of bigeye were taken in the Northern, Equatorial, and Southern floating-object fisheries. Negligible amounts of bigeye were caught in sets on unassociated schools, in floatingobject sets in the Inshore area, and in sets on schools associated with dolphins. There were no recorded catches of bigeye by pole-and-line vessels. The estimated size compositions of the bigeye caught by all fisheries combined during are shown in Figure A-8b. The average weight of the fish was greatest in 2000, when the greatest catch of bigeye was taken. Since 2002 the average weights of bigeye have been fairly constant. The smaller bigeye (40-60 cm) were caught mainly during the latter half of 2004, while most of the larger fish were caught during the fourth quarter. Pacific bluefin are caught by purse-seine and recreational gear off California and Baja California from about 23 N to 35 N, with most of the catch being taken during May through October. During 2004 bluefin were caught between 26 N and 31 N from May through August. 11
14 12 The majority of the catches of bluefin by both commercial and recreational vessels were taken during July and August. In the past, commercial and recreational catches have been reported separately. In 2004, however, only 10 samples were taken from recreational vessels and only 14 from commercial vessels (from the total of 496 samples for 2004), making it infeasible to estimate the catches and size compositions separately. Therefore, the commercial and recreational catches of bluefin were combined for each year of the period. The estimated size compositions are shown in Figure A-9. The commercial catch (8,548 t) of bluefin far exceeded the recreational catch (53 t), but the estimate for the latter is very preliminary. Black skipjack are caught incidentally by fishermen who direct their effort toward yellowfin, skipjack, and bigeye tuna. The demand for this species is low, so most of the catch is discarded at sea, but small amounts, mixed with the more desirable species, are sometimes retained. Because only one sample of black skipjack was taken from the 496 wells sampled during 2004, length-frequency histograms for this species are not presented in this report Longline fishery The estimated size compositions of the catches of yellowfin and bigeye by the Japanese longline fishery in the EPO during are shown in Figures A-10 and A-11. The average weights of both yellowfin and bigeye taken by that fishery have remained about the same throughout its existence. Information on the size compositions of fish caught by the Japanese longline fishery in the EPO during is available in IATTC Bulletins describing that fishery Catches of tunas and bonitos, by flag and gear The annual retained catches of tunas and bonitos in the EPO during , by flag and gear, are shown in Tables A-3a-e. These tables include all of the known catches of tunas and bonitos compiled from records gathered from governments, fish-processing companies, logbooks, and import-export records. Similar information on tunas and bonitos prior to 2000, and historic data for tunas, billfishes, sharks, carangids, dorado, and miscellaneous fishes are available on the IATTC web site. The purse-seine and pole-and-line catches of tunas and bonitos in 2003 and 2004, by flag, are summarized in Tables A-4a-b (top panels) Landings of tunas and bonitos by purse-seine and pole-and-line vessels The landings are fish unloaded from fishing vessels during a calendar year, regardless of the year of catch. The country of landing is that in which the fish were unloaded or, in the case of transshipments, the country that received the transshipped fish. Preliminary landings data for 2003 and 2004 (Tables A-4a-b, lower panels) indicate that, of the 563 thousand t of tunas and bonitos landed in 2004, 49% was landed in Ecuador and 25% in Mexico. Other countries with significant landings of tunas and bonitos caught in the EPO included Colombia (11%), and Costa Rica and Venezuela (4% each). It is important to note that, when final information is available, the landings currently assigned to various countries may change due to exports from storage facilities to processors in other nations Purse-seine catches per cubic meter of well volume The total retained catch per cubic meter of well volume (C/m 3 ) for the purse-seine vessels that fish for tunas in the EPO are presented in Table A-7 for the EPO, by vessel size group and species, for To provide more detail in this index than would be available if the IATTC's historical six classes of vessel capacity classification were used, the vessels are assigned to eight size groups. Yellowfin, skipjack, and bigeye contribute the most to the C/m 3 for the larger vessels, while other species of tuna, such as black skipjack, make up an important part of the C/m 3 of the smaller vessels in many years. 2. EFFORT 2.1. Purse seine Tunas are caught by purse-seine vessels in three types of schools, those associated with dolphins, those associated with floating objects, such as flotsam or FADs, and those associated only with other fish (unassociated schools). Estimates of the numbers of purse-seine sets of each type in the EPO during the period, and the retained catches of these sets, are shown in Table A-8 and in the figure on this page. The estimates for Class-1 to -5 vessels were calculated from logbook data in the IATTC statistical data base, and those for Class-6 vessels were calculated from the observer data bases of the IATTC, Ecuador, the European Union, Mexico, the United States, and Venezuela. The greatest numbers of sets on schools associated with floating objects and on unassociated schools of tuna were made from the mid-1970s to the early 1980s. Despite opposition to fishing for tunas associated with dolphins and the refusal of U.S. canners to accept tunas caught during trips during which sets were made on dolphin-associated fish, the numbers of sets made on fish associated with dolphins decreased only moderately during the mid-1990s, and in 2003 were the greatest recorded.


15 There are two types of floating objects, flotsam and FADs. The occurrence of the former is unplanned from the point of view of the fishermen, whereas the latter are constructed by fishermen specifically for the purpose of attracting fish. FADs have been widely used for about 10 years, and their relative importance has increased during this period, while that of flotsam has decreased, as shown by the data in Table A Longline The reported annual effort, in total number of hooks, regardless of the target species, and the catches of the predominant tuna species by longline vessels in the EPO are shown in Table A-10. The data for China, Chinese Taipei, French Polynesia, Japan, the Republic of Korea ( only), and the United States are representative of total catch and effort, whereas those of Mexico, Panama, the Republic of Korea ( ), and Vanuatu, which were compiled from logbook data, do not represent the totals. 3. THE FLEETS 3.1. The purse-seine and pole-and-line fleets The IATTC maintains detailed records of gear, flag, and fish-carrying capacity for most of the vessels that fish with purse-seine or pole-and-line gear for yellowfin, skipjack, bigeye, and/or Pacific bluefin tuna in the EPO. The fleet described here includes purse-seine and pole-and-line vessels that have fished all or part of the year in the EPO for these four species. Historically the owner's or builder's estimates of carrying capacities of Purse-seine catches of tunas, by species and set type, individual vessels, in tons of fish, were used until landing records indicated that revision of these estimates was required. The vessels were grouped, by carrying capacity, originally in short tons and later in metric tons, into six size classes. For the past several years the IATTC has used well volume, in cubic meters (m 3 ), instead of weight, in metric tons (t), to measure the carrying capacities of the vessels. Since a well can be loaded with different densities of fish, measuring carrying capacity in weight is subjective, as a load of fish packed into a well at a higher density weighs more than a load of fish packed at a lower density. Using volume as a measure of capacity eliminates this problem. The IATTC staff began collecting capacity data by volume in 1999, but has not yet obtained this information for all vessels. For vessels for which reliable information on well volume is not available, the estimated capacity in metric tons was converted to cubic meters. Until about 1960 fishing for tunas in the EPO was dominated by pole-and-line vessels operating in coastal regions and in the vicinity of offshore islands and banks. During the late 1950s and early 1960s most of the larger pole-and-line vessels were converted to purse seiners, and by 1961 the EPO fishery was dominated by these vessels. From 1961 to 2004 the number of pole-and-line vessels decreased from 93 to 3, and their total well volume from about 11 thousand to about 3 hundred cubic meters (m 3 ). During the same period the number of purse seiners increased from 125 to 215, and their total well volume from about 32 thousand to about 206 Carrying capacity, in cubic meters of well volume, of the purse-seine and pole-and-line fleets in the EPO, thousand m 3, an average of about 958 m 3 per vessel. An earlier peak in numbers and total well volume of purse seiners occurred from the mid-1970s to the early 1980s, when the number of vessels reached 282 and the total well volume about 195 thousand m 3, an average of about 693 m 3 per vessel (Table A-11; figure on this page). The catch rates in the EPO were low during , due to concentration of fishing effort on small fish, and the situation was exacerbated by a major El Niño event, which began in mid-1982 and persisted until late 1983 and made the fish less vulnerable to capture. 13
16 14 The total well volume then declined as vessels were deactivated or left the EPO to fish in other areas, primarily the western Pacific Ocean, and in 1984 it reached its lowest level since 1971, about 125 thousand m 3. In early 1990 the U.S. tuna-canning industry adopted a policy of not purchasing tunas caught during trips during which sets on tunas associated with dolphins were made. This caused many U.S.-flag vessels to leave the EPO, with a consequent reduction in the fleet to about 119 thousand m 3 in With increases in participation of vessels of other nations in the fishery, the total well volume has increased steadily since 1992, and in 2004 was 206 thousand m 3. The 2003 and preliminary 2004 data for numbers and total well volumes of purse seiners and pole-and-line vessels that fished for tunas in the EPO are shown in Tables A-12a-b. The fleet was dominated by vessels operating under the Mexican and Ecuadorian flags during The Mexican fleet had about 25% of the total well volume during 2004, Ecuador about 24%, Venezuela about 15%, Panama about 13%, and Colombia, Spain, and the USA about 4% each. Class-6 vessels made up about 91% of the total well volume of the purse-seine fleet operating in the EPO during The cumulative capacity at sea during 2004 is compared to those of the previous four years in the figure on this page. The monthly average, minimum, and maximum total well volumes at sea (VAS), in thousands of cubic meters, of purse-seine and pole-and-line vessels that fished for tunas in the EPO during , and the 2004 values, are shown in Table A-13. The monthly values are averages of the VAS estimated at weekly intervals by the IATTC staff. The fishery was regulated during some or all of the last four months of , so the VAS values for September- December 2004 are not comparable to the average VAS values for those months of The VAS values for 2004 exceeded the maximum VAS values for for every month. The average VAS values for and 2004 were 96 thousand m 3 (58% of total capacity) and 129 thousand m 3 (63% of total capacity), respectively Other fleets of the EPO Cumulative capacity of the purse-seine and pole-and-line fleet at sea, Information on other types of vessels that fish for tunas in the by month, EPO is available on the IATTC s Regional Vessel Register, on the IATTC web site. The Register is incomplete for small vessels,. It contains records for large (>24 m) longline vessels of some nations that fish in the EPO and in other areas.
17 15 FIGURE A-1a. Average annual distributions of the purse-seine catches of yellowfin, by set type, The sizes of the circles are proportional to the amounts of yellowfin caught in those 5 by 5 areas. FIGURA A-1a. Distribución media anual de las capturas cerqueras de aleta amarilla, por tipo de lance, El tamaño de cada círculo es proporcional a la cantidad de aleta amarilla capturado en la zona de 5 x 5 correspondiente. FIGURE A-1b. Average annual distributions of the purse-seine catches of yellowfin, by set type, The sizes of the circles are proportional to the amounts of yellowfin caught in those 5 by 5 areas. FIGURA A-1b. Distribución media anual de las capturas cerqueras de aleta amarilla, por tipo de lance, El tamaño de cada círculo es proporcional a la cantidad de aleta amarilla capturado en la zona de 5 x 5 correspondiente.
18 16 FIGURE A-2a. Average annual distributions of the purse-seine catches of skipjack, by set type, The sizes of the circles are proportional to the amounts of skipjack caught in those 5 by 5 areas. FIGURA A-2a. Distribución media anual de las capturas cerqueras de barrilete, por tipo de lance, El tamaño de cada círculo es proporcional a la cantidad de barrilete capturado en la zona de 5 x 5 correspondiente. FIGURE A-2b. Average annual distributions of the purse-seine catches of skipjack, by set type, The sizes of the circles are proportional to the amounts of skipjack caught in those 5 by 5 areas. FIGURA A-2b. Distribución media anual de las capturas cerqueras de barrilete, por tipo de lance, El tamaño de cada círculo es proporcional a la cantidad de barrilete capturado en la zona de 5 x 5 correspondiente.
19 17 FIGURE A-3a. Average annual distributions of the purse-seine catches of bigeye, by set type, The sizes of the circles are proportional to the amounts of bigeye caught in those 5 by 5 areas. FIGURA A-3a. Distribución media anual de las capturas cerqueras de patudo, por tipo de lance, El tamaño de cada círculo es proporcional a la cantidad de patudo capturado en la zona de 5 x 5 correspondiente. FIGURE A-3b. Average annual distributions of the purse-seine catches of bigeye, by set type, The sizes of the circles are proportional to the amounts of bigeye caught in those 5 by 5 areas. FIGURA A-3b. Distribución media anual de las capturas cerqueras de patudo, por tipo de lance, El tamaño de cada círculo es proporcional a la cantidad de patudo capturado en la zona de 5 x 5 correspondiente.


20 18 FIGURE A-4. Distribution of the catches of bigeye and yellowfin tunas in the Pacific Ocean, in metric tons, by the Japanese longline fleet, The sizes of the circles are proportional to the amounts of bigeye and yellowfin caught in those 5 by 5 areas. FIGURA A-4. Distribución de las capturas de atunes patudo y aleta amarilla en el Océano Pacifico, en toneladas métricas, por la flota palangrera japonesa, El tamaño de cada círculo es proporcional a la cantidad de patudo y aleta amarilla capturado en la zona de 5 x 5 correspondiente.
21 FIGURE A-5. The fisheries defined by the IATTC staff for stock assessment of yellowfin, skipjack, and bigeye in the EPO. The thin lines indicate the boundaries of the 13 length-frequency sampling areas, and the bold lines the boundaries of the fisheries. FIGURA A-5. Las pesquerías definidas por el personal de la CIAT para la evaluación de las poblaciones de atún aleta amarilla, barrilete, y patudo en el OPO. Las líneas delgadas indican los límites de las 13 zonas de muestreo de frecuencia de tallas, y las líneas gruesas los límites de las pesquerías. 19
22 20 FIGURE A-6a. Estimated size compositions of the yellowfin caught in each fishery of the EPO during The average weights of the fish in the samples are given at the tops of the panels. FIGURA A-6a. Composición por tallas estimada del aleta amarilla capturado en cada pesquería del OPO en En cada recuadro se detalla el peso promedio de los peces en las muestras.
23 FIGURE A-6b. Estimated size compositions of the yellowfin caught by purse-seine and pole-and-line vessels in the EPO during The average weights of the fish in the samples are given at the tops of the panels. FIGURA A-6b. Composición por tallas estimada del aleta amarilla capturado por buques cerqueros y cañeros en el OPO durante En cada recuadro se detalla el peso promedio de los peces en las muestras. 21
24 22 FIGURE A-7a. Estimated size compositions of the skipjack caught in each fishery of the EPO during The average weights of the fish in the samples are given at the tops of the panels. FIGURA A-7a. Composición por tallas estimada del barrilete capturado en cada pesquería del OPO en En cada recuadro se detalla el peso promedio de los peces en las muestras.
25 FIGURE A-7b. Estimated size compositions of the skipjack caught by purse-seine and pole-and-line vessels in the EPO during The average weights of the fish in the samples are given at the tops of the panels. FIGURA A-7b. Composición por tallas estimada del barrilete capturado por buques cerqueros y cañeros en el OPO durante En cada recuadro se detalla el peso promedio de los peces en las muestras. 23
26 24 FIGURE A-8a. Estimated size compositions of the bigeye caught in each fishery of the EPO during The average weights of the fish in the samples are given at the tops of the panels. FIGURA A-8a. Composición por tallas estimada del patudo capturado en cada pesquería del OPO en En cada recuadro se detalla el peso promedio de los peces en las muestras.
27 FIGURE A-8b. Estimated size compositions of the bigeye caught by purse-seine vessels in the EPO during The average weights of the fish in the samples are given at the tops of the panels. FIGURA A-8b. Composición por tallas estimada para el patudo capturado por buques cerqueros en el OPO durante En cada recuadro se detalla el peso promedio de los peces en las muestras. 25
28 26 FIGURE A-9. Estimated catches of Pacific bluefin by purse-seine and recreational gear in the EPO during The values at the tops of the panels are the average weights. FIGURA A-9. Captura estimada de aleta azul del Pacífico por buques cerqueros y deportivos en el OPO durante El valor en cada recuadro representa el peso promedio.
29 27 FIGURE A-10. Estimated size compositions of the catches of yellowfin tuna by the Japanese longline fishery in the EPO, FIGURA A-10. Composición por tallas estimada de las capturas de atún aleta amarilla por la pesquería palangrera japonesa en el OPO, FIGURE A-11. Estimated size compositions of the catches of bigeye tuna by the Japanese longline fishery in the EPO, FIGURA A-11. Composición por tallas estimada de las capturas de atún patudo por la pesquería palangrera japonesa en el OPO,
30 28 TABLE A-1. Annual catches of yellowfin, skipjack, and bigeye, by all types of gear combined, in the Pacific Ocean, The EPO totals for include discards from the purse-seine fishery. TABLA A-1. Capturas anuales de aleta amarilla, barrilete, y patudo, por todas las artes combinadas, en el Océano Pacífico, Los totales del OPO de incluyen descartes de la pesquería de cerco. YFT SKJ BET Total EPO WCPO Total EPO WCPO Total EPO WCPO Total EPO WCPO Total , , , , , ,713 48,344 60, , , , , , , , , , ,825 71,585 73, , , ,700 1,019, , , ,180 94, , ,212 85,251 73, , , ,382 1,033, , , , , , ,148 89,198 58, , , ,098 1,125, , , , , , ,808 67,533 65, , , ,316 1,067, , , , , , ,528 86,403 62, , , ,086 1,114, , , , , , ,181 68,340 53, , , ,556 1,089, , , , , , ,774 60,346 58, , , ,279 1,061, , , ,881 62, , ,970 64,754 59, , , ,276 1,224, , , ,134 63, , ,150 55,273 63, , ,364 1,067,838 1,336, , , ,165 52, , ,787 72,404 68, , , ,435 1,274, , , ,696 67, , , ,119 63, , ,017 1,064,731 1,523, , , ,281 66, , , ,313 80, , ,137 1,068,550 1,522, , , ,102 92, , ,801 74,304 68, , ,064 1,169,178 1,632, , , ,139 98, , ,172 72,994 75, , ,662 1,206,911 1,678, , , ,213 77, , , ,806 91, , ,209 1,333,893 1,818, , , ,405 65,895 1,121,092 1,186, ,116 77, , ,099 1,589,985 2,031, , , ,177 87,354 1,011,401 1,098,755 92,000 92, , ,065 1,507,575 1,940, , , , , ,534 1,008,055 82,834 80, , ,030 1,377,775 1,817, , , ,145 84,526 1,004,300 1,088, ,346 90, , ,187 1,497,616 1,939, , , , ,667 1,050,337 1,201, ,208 81, , ,476 1,506,614 2,010, , , , ,931 1,026,792 1,159, ,704 80, , ,099 1,424,024 1,938, , , , , ,985 1,161, , , , ,107 1,524,081 2,113, , , , ,467 1,301,054 1,466,521 93, , , ,553 1,871,442 2,410, , , , ,954 1,154,102 1,446,056 93, , , ,853 1,698,729 2,388, , , , ,806 1,245,003 1,476, , , , ,306 1,783,304 2,451, , , , ,665 1,134,772 1,292, , , , ,168 1,665,949 2,378, , , , ,802 1,277,431 1,443, , , , ,098 1,795,506 2,532, , , , ,287 1,252,738 1,549, ,860 95, , ,907 1,805,676 2,626, ,597 * * 213,855 * * 108,290 * * 598,743 * *
31 TABLE A-2a. Estimated retained catches, by gear type, and estimated discards (purse-seine only), of tunas and bonitos, in metric tons, in the EPO, The purseseine and pole-and-line data for yellowfin, skipjack, and bigeye tunas have been adjusted to the species composition estimate and are preliminary. The data for are preliminary. TABLA A-2a. Estimaciones de las capturas retenidas, por arte de pesca, y de los descartes (red de cerco únicamente), de atunes y bonitos, en toneladas métricas, en el OPO, Los datos de los atunes aleta amarilla, barrilete, y patudo de las pesquerías cerquera y cañera fueron ajustados a la estimación de composición por especie, y son preliminares. Los datos de son preliminares. Yellowfin Aleta amarilla (YFT) Skipjack Barrilete (SKJ) Bigeye Patudo (BET) PS PS PS LP LL OTR Total LP LL OTR Total Ret. Dis. Ret. Dis. Ret. Dis. LP LL OTR Total ,029 5,630 10, , ,358 13, ,733 6, , , ,106 3,280 15, , ,958 11, ,926 17, , , ,922 1,841 12, ,382 84,606 7, ,872 94,111 11, , , ,800 3,887 10,188 1, , ,293 6, , ,675 18, , , ,648 4,790 11, , ,695 6, , ,504 12, , , ,042 1,480 13, , ,912 5, , ,109 21, , , ,235 1,477 7, , ,165 5, ,003 14, , , ,754 1,538 10, , ,498 3, ,669 6, , , ,928 4,007 10,894 1, ,011 56,851 4, ,149 4, , , ,785 2,991 10, ,478 59,859 2, ,612 8, , , ,460 1,069 13, ,034 50, ,002 6, , , ,512 2,537 22, ,150 65,635 1, ,748 2, , , ,007 5,107 18, ,359 64,019 2, ,465 1, , , ,293 3,723 14, ,634 87,113 4, ,126 1, , , ,995 4,145 17, ,737 94,935 2, ,027 98,931 2, , , ,251 2,675 34,634 1, ,283 74, ,885 77,120 5, , , ,257 2,856 30,729 1, ,089 62,229 1, ,916 65,895 4, , , ,121 3,789 18,526 3, ,711 84,283 1, ,091 87,354 7, , , ,494 4,722 4,950 23,808 3, ,674 83,829 10,588 3, , ,521 9, , , ,409 4,757 3,625 29,545 1, ,314 70,127 10,360 3, ,526 34,900 2, , , ,434 5,275 1,268 20,054 2, , ,045 16,378 5, , ,667 45,319 3, ,256 1, , ,606 6,314 3,761 16,426 1, , ,976 24,837 2, , ,931 61,312 5, , , ,878 5,516 4,418 21,448 2, , ,456 31,558 3, ,497 64,270 5, , , ,959 4,718 5,084 14,196 2, , ,631 22,856 1, ,467 44,128 2, , , ,920 6,638 1,783 10,642 3, , ,564 26,851 2, , ,954 51,158 5, , , ,988 6,796 2,386 22,766 2, , ,240 26, ,806 94,083 5, , , ,402 7,486 3,785 28,482 1, , ,948 11, , ,665 61,259 1, , , ,285 3, , , ,633 11, ,802 57, ,523 4, ,192 2, , ,089 20, ,287 54,103 1, ,356 2,853 1,905 2,041 1, , ,911 16, ,855 66,944 1, , ,449 29
32 30 TABLE A-2a. (continued) TABLA A-2a. (continuación) Pacific bluefin Aleta azul del Pacífico (PBF) Albacore Albacora (ALB) Black skipjack Barrilete negro (BKJ) PS PS PS LP LL OTR Total LP LL OTR Total Ret. Dis. Ret. Dis. Ret. Dis. LP LL OTR Total , , ,332 1,369 19,706 24, , , ,456 2,506 16,975 23,208 1, , , , ,960 10,578 11,471 24,024 1, , , , ,577 11,939 17,436 31,109 2, , , , ,583 5,043 10,953 1, , , , ,319 5,649 11,569 3, , , , ,275 12,301 20,282 1, , , , ,407 3,562 12,522 1, , ,433 7,840 15,730 1, , ,910 1,441 6,712 9,794 21, , , ,268 6,654 14, , , ,450 4,701 11, , ,994 2,661 12, , , ,934 5,549 15, , , , ,784 2,695 9, , , ,536 4,105 10, ,894 2,754 11, , , ,081 5,740 23, ,194 4,410 15, , , , ,390 10,075 20, , ,184 7,386 14, , , , , ,631 8,398 16, , , , , ,678 7,532 17, , , , , ,635 12,966 25, , , , , ,632 14,494 26, , , , , ,663 13,387 23, , , , ,410 13,679 33,111 2,258 1, , , , ,837 14,406 29,274 1,459 1, , , , ,186 22,900 44, , , , , ,509 7,676 19, ,200
33 TABLE A-2a. (continued) TABLA A-2a. (continuación) Bonito (BZX) Unidentified tunas Atunes no identificados (TUN) Scombrids Escómbridos TOTAL PS PS PS LP LL OTR Total LP LL OTR Total Ret. Dis. Ret. Dis. Ret. Dis. LP LL OTR Total , , ,670 7, ,725 23,015 53,886 28, , , , ,981 5, ,088 18,161 72,616 23, , , ,875 14, ,782 5, ,601 11,638 97,188 22, , , ,419 7, ,677 6, ,333 11,555 92,885 28, , , ,658 4, ,016 3, ,386 11,354 72,565 12, , , ,727 8, , ,179 7,176 83,170 12, , , ,609 10, ,109 1, ,319 8,025 68,723 19, , , ,776 8, ,203 5,537 72,775 11, , , ,291 11, ,711 4, ,326 8,884 78,410 22, , , ,291 10, ,524 2, ,437 7,318 63,493 20, , , ,869 11, ,291 2,898 86,837 15, , ,889 2, , ,905 4, ,744 8, , , ,772 5, ,043 2, ,432 7, ,078 7, , , , ,939 3, ,363 9,062 97,397 11, , , , , ,613 7,930 94,814 5, , , , , ,830 3, ,096 8, , , , ,407 5, ,856 6, , , ,071 1, ,725 6, ,453 11, , , , ,082 6, ,275 22,370 8, ,559 15, , , , , , ,934 19,734 7, ,375 14, , , , , ,004 2, ,571 27,800 7,067 84,596 14, , , ,038 2, ,515 40,900 6,395 71,087 13, , , , , ,437 6, ,484 49,655 7,748 83,813 11, , , , , ,158 20, ,367 34,601 6,896 73,363 35, , , , , ,107 4,279 9, ,161 45,613 4,059 61,090 25, , , ,986 1,468 5, ,220 42,703 2,769 82,193 17, , , , , ,985 24,220 4, ,305 15, , , , , ,105 20,530 1, ,217 15, , * 25 * 81 2, , ,496 29, ,988 25, , * * * 267 2, ,054 * * 541,996 24,085 2,387 56,528 9, ,190 31
34 32 TABLE A-2b. Estimated retained catches, by gear type, and estimated purse-seine discards, of billfishes, in metric tons, in the EPO, Data for are preliminary. PS dis = purse-seine discards. TABLA A-2b. Estimaciones de las capturas retenidas, por arte de pesca, y de los descartes (red de cerco únicamente), de peces picudos, en toneladas métricas, en el OPO, Los datos de son preliminares. PS dis = descartes de la pesca de cerco. Swordfish Pez espada (SWO) Blue marlin Marlín azul (BUM) Black marlin Marlín negro (BLM) Striped marlin Marlín rayado (MLS) PS dis. LL OTR Total PS dis. LL OTR Total PS dis. LL OTR Total PS dis. LL OTR Total , ,185 2,200 2, , , ,852 3,240 3, , , ,086 3,016 3, , ,103 2,205 6,308 3,570 3, , , ,272 4,528 4, , ,746 1,107 4,853 4,016 4, , ,070 1,134 4,204 4,476 4, , ,604 1,551 4,155 4,745 4, , ,221 2,338 5,559 4,451 4, , ,705 3,336 6,041 5,197 5, , ,867 3,768 5,635 3,588 3, , ,887 3,294 6,181 5,255 5, , ,140 3,740 7,880 7,227 7, , ,322 5,642 9,964 5,649 5, , ,514 6,072 10,586 5,392 5, , ,807 5,066 10,873 5,540 5, , ,564 4,385 14, , , , ,793 4,294 14, , , , ,167 4,434 10, , , , ,963 3,849 8, , , , ,466 3,003 7, , , , ,756 2,801 9, , , , ,508 2,854 12, , , , ,326 3,713 13, , , , ,374 2,161 9, , , , ,474 2,790 12, , , , ,756 2,615 18, , , , ,293 2,600 18, , , , , , , , , , ,
35 TABLE A-2b. (continued) TABLA A-2b. (continuación) Shortbill spearfish Marlín trompa corta (SSP) Sailfish Pez vela (SFA) Unidentified Istiophorid billfishes Picudos Istiofóridos no identificados (BIL) Billfishes Peces picudos TOTAL PS dis. LL OTR Total PS dis. LL OTR Total PS dis. LL OTR Total PS dis. LL OTR Total , , , , , , ,463 2,205 13, , , ,168 1,107 14, ,048 1,134 14, ,084 1,084 13,357 1,551 14, ,694 2,338 15, ,157 3,336 14, ,540 3,768 11, ,587 3,294 14, ,057 3,740 21, ,786 5,642 20, ,683 6,072 19, ,959 5,066 20, ,199 5,537 25, ,392 1,082 1, ,178 5,252 26, ,145 1,121 2, ,610 1, ,751 6,090 25, , ,937 5,341 24, ,114 1, ,126 4,767 20, ,833 3,780 17, , , , ,594 3,884 25, , ,408 5,614 24, ,113 1, , , ,280 4,288 18, ,239 1, ,588 4,961 20, ,289 1, , , ,823 5,025 28, , , ,139 3,229 26, ,012 1, , , ,090 2,415 23, * * , ,543 33
36 34 TABLE A-2c. Estimated retained catches, by gear type, and estimated purse-seine discards, of other species, in metric tons, in the EPO, Data for are preliminary. TABLA A-2c. Estimaciones de las capturas retenidas, por arte de pesca, y de los descartes (red de cerco únicamente), de otras especies, en toneladas métricas, en el OPO, Los datos de son preliminares. Unidentified carangids Carángidos no identificados (CGX) Dorado (Coryphaena spp.) (DOX) Unidentified elasmobranchs Elasmobranquios no identificados (SKX) Unidentified fishes Peces no identificados (MZZ) PS PS PS PS LP LL OTR Total LP LL OTR Total LP LL OTR Total Ret. Dis. Ret. Dis. Ret. Dis. Ret. Dis. LP LL OTR Total , , , , ,290 1, ,001 1, , ,211 1, , , , , ,374 3, ,039 1, ,828 2, ,979 2, ,272 4, ,019 1, ,560 1, ,041 1, ,680 1, ,025 1, ,491 1, ,096 1, ,346 1, ,190 1, , , , ,459 5, ,315 2, , ,127 3, ,077 1, , , ,151 2, , ,411 11, ,360 3, , , ,656 13, ,483 5, , ,313 2, , ,333 5,111 9, ,289 2,145 6, , , , ,550 1,041 6, , , ,348 1, , ,722 11,357 18, , , ,518 1, , ,915 4,208 10, , , ,745 2, , ,133 6, , , ,011 4, , , , , * *
37 35 TABLE A-3a. Estimates of the retained catches of tunas and bonitos, by flag, gear type, and species, in metric tons, in the EPO, The purse-seine and pole-and-line data for yellowfin, skipjack, and bigeye tunas have been adjusted to the species composition estimates and are preliminary. TABLA A-3a. Estimaciones de las capturas retenidas de atunes y bonitos, por bandera, arte de pesca, y especie, en toneladas métricas, en el OPO, Los datos de los atunes aleta amarilla, barrilete, y patudo de las pesquerías cerquera y cañera fueron ajustados a la estimación de composición por especie, y son preliminares YFT SKJ BET PBF ALB BKJ BZX TUN Total CAN LTL 3,900 3,900 CHL NK COL PS 16,509 6, ,555 CRI NK 1, ,111 ECU NK PS 34, ,174 37, ,645 ESP PS 5,147 16,288 18, ,366 GTM LL ,985 2,070 JPN LL 15, , ,180 45,194 KOR LL 5, , ,758 MEX LL LP 2, ,649 PS 97,703 16,928 f1 3, ,362 PAN LL PS 3,619 12,647 6, ,570 PER NK 1,468 1,468 PYF LL 1, ,638 4,382 TWN LL , ,151 7,810 USA GN LL LTL 7,686 7,686 PS 3,053 10,117 3, ,878 RG ,798 2,511 VEN PS 68,672 5, ,080 VUT LL 5 2, ,080 PS 12,618 11,618 7, ,959 OTR 1 LL LP PS 4 13,308 20,997 18, ,806 1 This category is used to avoid revealing the operations of individual vessels or companies Se usa esta categoría para no revelar información sobre las actividades de buques o empresas individuales. 2 Includes El Salvador and Nicaragua Incluye y El Salvador y Nicaragua. 3 Includes Ecuador and United States Incluye Ecuador y Estados Unidos. 4 Includes Belize, Bolivia, Guatemala, Honduras, Nicaragua, and unknown Incluye Belice, Bolivia, Guatemala, Honduras, Nicaragua, y desconocido.
38 36 TABLE A-3b. Estimates of the retained catches of tunas and bonitos, by flag, gear type, and species, in metric tons, in the EPO, The purse-seine and pole-and-line data for yellowfin, skipjack, and bigeye tunas have been adjusted to the species composition estimates and are preliminary. TABLA A-3b. Estimaciones de las capturas retenidas de atunes y bonitos, por bandera, arte de pesca, y especie, en toneladas métricas, en el OPO, Los datos de los atunes aleta amarilla, barrilete, y patudo de las pesquerías cerquera y cañera fueron ajustados a las estimaciones de composición por especie, y son preliminares YFT SKJ BET PBF ALB BKJ BZX TUN Total BLZ LL 1,833 1,080 1, ,854 9,885 CAN LTL 4,600 4,600 CHL NK CHN LL 942 2,639 1,581 5,162 COL PS 24,662 2, ,278 CRI NK 1, ,161 ECU NK PS 55,268 67,617 25, , ,674 ESP PS 10,878 21,531 7, ,290 GTM LL ,321 2,363 JPN LL 14, , ,889 54,771 KOR LL 5, , ,200 MEX LL LP 3, ,373 PS 126,096 9, ,768 PAN LL PS 11,772 6,175 2, ,472 PYF LL ,542 5,086 TWN LL 3, , ,811 20,027 USA GN LL LTL 7,439 7,439 PS 5,230 3,699 3, ,419 RG 356 1,635 1,991 VEN PS 106,777 3, ,054 VUT LL 13 3, ,584 PS 10,246 7,267 5, ,205 OTR 1 LL PS 3 31,472 22,355 15, ,823 This category is used to avoid revealing the operations of individual vessels or companies Se usa esta categoría para no revelar información sobre las actividades de buques o empresas individuales. 2 Includes El Salvador and Nicaragua Incluye El Salvador y Nicaragua. 3 Includes Belize, Bolivia, China, El Salvador, Guatemala, Honduras, Nicaragua. and unknown Incluye Belice, Bolivia, China, El Salvador, Guatemala, Honduras, Nicaragua, y desconocido.
39 37 TABLE A-3c. Estimates of the retained catches of tunas and bonitos, by flag, gear type, and species, in metric tons, in the EPO, 2002.The purse-seine and pole-and-line data for yellowfin, skipjack, and bigeye tunas have been adjusted to the species composition estimates and are preliminary. TABLA A-3c. Estimaciones de las capturas retenidas de atunes y bonitos, por bandera, arte de pesca, y especie, en toneladas métricas, en el OPO, Los datos de los atunes aleta amarilla, barrilete, y patudo de las pesquerías cerquera y cañera fueron ajustados a las estimaciones de composición por especie, y son preliminares YFT SKJ BET PBF ALB BKJ BZX TUN Total CAN LTL 4,753 4,753 CHL NK CHN LL 1,457 7,614 1,327 10,398 COL PS 31,150 2, ,816 CRI NK ECU NK 5 5 PS 37,314 75,701 27, ,518 ESP PS 5,465 21,646 5, ,030 JPN LL 8, , ,622 45,347 KOR LL 3, , ,370 MEX LL LP ,459 PS 151,213 7, , ,513 PAN LL PS 19,514 7,955 2, ,213 PYF LL ,545 3,238 TWN LL 7, , ,096 31,736 USA GN LL LTL 7,256 7,256 PS 6,639 3,723 3, ,691 RG 351 2,357 2,708 VEN PS 119,473 4, ,433 VUT LL 290 2, ,187 PS 5,197 6,876 2, ,521 OTR 1 LL ,790 2,954 PS 3 36,319 23,918 14, ,370 This category is used to avoid revealing the operations of individual vessels or companies Se usa esta categoría para no revelar información sobre las actividades de buques o empresas individuales. 2 Includes El Salvador, Guatemala, Honduras, and Nicaragua Incluye El Salvador, Guatemala, Honduras, y Nicaragua. 3 Includes Belize, Bolivia, El Salvador, Guatemala, Honduras, Nicaragua, Peru, and unknown Incluye Belice, Bolivia, El Salvador, Guatemala, Honduras, Nicaragua, Perú, y desconocido.
40 38 TABLE A-3d. Preliminary estimates of the retained catches of tunas and bonitos, by flag, gear type, and species, in metric tons, in the EPO, The purse-seine and pole-and-line data for yellowfin, skipjack, and bigeye tunas have been adjusted to the species composition estimates and are preliminary. TABLA A-3d. Estimaciones preliminares de las capturas retenidas de atunes y bonitos, por bandera, arte de pesca, y especie, en toneladas métricas, en el OPO, Los datos de los atunes aleta amarilla, barrilete, y patudo de las pesquerías cerquera y cañera fueron ajustados a las estimaciones de composición por especie, y son preliminares YFT SKJ BET PBF ALB BKJ BZX TUN Total CAN LTL 6,295 6,295 CHL NK CHN LL 2,739 10,066 1,743 14,548 COL PS 22,693 4, ,772 CRI NK 1, ,401 ECU NK LL PS 35, ,216 21, ,283 ESP LL PS 4,726 25,152 6, ,273 JPN LL 9, , ,303 37,352 KOR LL 4, , ,551 MEX LL LP PS 164,284 13, , ,782 PAN LL PS 27,530 14,480 5, ,415 TWN LL 3, ,016 12,663 28,227 USA GN LL LTL 14,392 14,392 PS 993 6,430 3, ,962 RG ,212 3,687 VEN PS 86,778 13,887 1, ,763 VUT LL 699 1,258 4,133 6,090 VUT PS 3,591 17,143 6, ,717 OTR 1 LL PS 3 33,936 37,952 8, ,528 This category is used to avoid revealing the operations of individual vessels or companies Se usa esta categoría para no revelar información sobre las actividades de buques o empresas individuales. 2 Includes Honduras and Nicaragua Incluye Honduras y Nicaragua. 3 Includes Belize, Bolivia, El Salvador, Guatemala, Honduras, Peru, and unknown Incluye Belice, Bolivia, El Salvador, Guatemala, Honduras, Perú, y desconocido.
41 39 TABLE A-3e. Preliminary estimates of the retained catches of tunas and bonitos, by flag, gear type, and species, in metric tons, in the EPO, The purse-seine and pole-and-line data for yellowfin, skipjack, and bigeye tunas have been adjusted to the species composition estimates and are preliminary. TABLA A-3e. Estimaciones preliminares de las capturas retenidas de atunes y bonitos, por bandera, arte de pesca, y especie, en toneladas métricas, en el OPO, Los datos de los atunes aleta amarilla, barrilete, y patudo de las pesquerías cerquera y cañera fueron ajustados a las estimaciones de composición por especie, y son preliminares YFT SKJ BET PBF ALB BKJ BZX TUN Total BLZ LL CAN LTL 7,676 7,676 CHN LL 2,602 2,602 CRI NK ECU PS 40,542 87,643 30, ,123 ESP LL 5 5 PS 3,913 14,901 6, ,391 JPN LL 18,458 18,458 KOR LL 10,729 10,729 MEX LL LP 1, ,386 PS 87,334 26, , ,949 PAN LL 3,054 3,054 PS 30,904 18,392 13, ,525 TWN LL 1,824 7,384 9,988 19,196 USA LL PS 1,977 4,745 4, ,223 RG 1, ,126 VEN PS 56,128 13, ,989 VUT LL 431 1,225 1,656 PS 1,760 7,205 5, ,102 OTR 1 PS 2 45,797 23,818 6, ,695 1 This category is used to avoid revealing the operations of individual vessels or companies Se usa esta categoría para no revelar información sobre las actividades de buques o empresas individuales. 2 Includes Bolivia, El Salvador, Guatemala, Honduras, Nicaragua, Peru, and unknown Incluye Bolivia, El Salvador, Guatemala, Honduras, Nicaragua, Perú, y desconocido.
42 40 TABLE A-4a. Estimates of the retained catches and landings, in metric tons, of tunas and bonitos caught by purse-seine and pole-and-line vessels in the EPO in 2003, by species and vessel flag (upper panel) and locations where processed (lower panel). The purse-seine and pole-and-line data for yellowfin, skipjack, and bigeye tunas have been adjusted to the species composition estimates and are preliminary. TABLA A-4a. Estimaciones de las capturas retenidas y descargas de atunes y bonitos capturado por buques cerqueros y cañeros en el OPO en 2003, por especie y bandera del buque (panel superior) y localidad donde fue procesado (panel inferior), en toneladas métricas. Los datos de los atunes aleta amarilla, barrilete, y patudo de las pesquerías cerquera y cañera fueron ajustados a las estimaciones de composición por especie, y son preliminares. YFT SKJ BET PBF ALB BKJ BZX TUN Total % Retained catches Capturas retenidas COL 22,693 4, , ECU 35, ,216 21, , ESP 4,726 25,152 6, , MEX 164,762 13, , , PAN 27,530 14,480 5, , USA 993 6,430 3, , VEN 86,778 13,887 1, , VUT 3,591 17,143 6, , OTR 1 33,936 37,952 8, , Total 381, ,506 54,102 3, ,395 Landings Descargas COL 58,319 10,131 2, , CRI 34,717 3, , ECU 72, ,795 39, , ESP 26,991 14,137 4, , MEX 152,952 13, , , USA 666 1, , VEN 21,811 5, , OTR 2 10,199 9,588 1, , Total 378, ,511 48,456 3, ,810 1 Includes Belize, Bolivia, El Salvador, Guatemala, Honduras, Peru, and unidentified. This category is used to avoid revealing the operations of individual vessels or companies. 1 Incluye Belice, Bolivia, El Salvador, Guatemala, Honduras, Perú, y no identificados. Se usa esta categoría para no revelar información sobre las actividades de buques o empresas individuales. 2 Includes El Salvador, Guatamala, Italy, Panama, Peru, Singapore, Thailand, and unidentified. This category is used to avoid revealing the operations of individual vessels or companies. 2 Incluye El Salvador, Guatamala, Italia, Panamá, Perú, Singapur, Tailandia, y no identificados. Se usa esta categoría para no revelar información sobre las actividades de buques o empresas individuales.
43 TABLE A-4b Preliminary estimates of the retained catches and landings, in metric tons, of tunas and bonitos caught by purse-seine, pole-and-line, and recreational vessels in the EPO in 2004, by species and vessel flag (upper panel) and locations where processed (lower panel). The purse-seine and pole-and-line data for yellowfin, skipjack, and bigeye tunas have been adjusted to the species composition estimates and are preliminary. TABLA A-4b. Estimaciones preliminares de las capturas retenidas y descargas de atunes y bonitos capturado con buques cerqueros, cañeros y deportivos en el OPO en 2004, por especie y bandera del buque (panel superior) y localidad donde fue procesado (panel inferior), en toneladas métricas. Los datos de los atunes aleta amarilla, barrilete, y patudo de las pesquerías cerquera y cañera fueron ajustados a las estimaciones de composición por especie, y son preliminares. YFT SKJ BET PBF ALB BKJ BZX TUN Total % Retained catches Capturas retenidas ECU 40,542 87,643 30, , ESP 3,913 14,901 6, , MEX 89,239 26, , , PAN 30,904 18,392 13, , USA 1,977 4,745 4, , VEN 56,128 13, , VUT 1,760 7,205 5, , OTR 1 45,797 23,818 6, , Total 270, ,392 66,945 8, ,383 Landings Descargas COL 47,356 10,600 2, , CRI 15,710 3,819 1, , ECU 75, ,535 59, , MEX 95,360 33,061 1,471 8, , VEN 22,127 2, , OTR 2 28,699 12,215 2, , Total 285, ,831 66,542 8, ,296 1 Includes, Bolivia, Colombia, El Salvador, Guatemala, Honduras, Nicaragua, and unidentified. This category is used to avoid revealing the operations of individual vessels or companies. 1 Incluye, Bolivia, Colombia, El Salvador, Guatemala, Honduras, Nicaragua, y no identificados. Se usa esta categoría para no revelar información sobre las actividades de buques o empresas individuales. 2 Includes El Salvador, Guatemala, Panama, Peru, Spain, United States, and unidentified. This category is used to avoid revealing the operations of individual vessels or companies. 2 Incluye El Salvador, España, Estados Unidos, Guatemala, Panamá, Perú, y no identificados. Se usa esta categoría para no revelar información sobre las actividades de buques o empresas individuales. 41
44 42 TABLE A-5. Annual retained catches of Pacific bluefin tuna, by gear type and flag, in metric tons. Source: Western and Central Pacific Fisheries Commission, International Scientific Committee, Report of the Third ISC Pacific Bluefin Tuna Working Group. TABLA A-5. Capturas retenidas anuales de atún aleta azul del Pacífico, por arte de pesca y bandera, en toneladas métricas. Fuente: Comisión de Pesca del Pacífico Occidental y Central, Comité Científico Internacional, Informe del Tercer Grupo de Trabajo sobre el Atún Aleta Azul del Pacífico. 1 Western Pacific flags Banderas del Pacífico occidental Eastern Pacific flags Banderas del Pacífico oriental PBF JPN KOR 1 TWN Subtotal USA 2 MEX Sub- Total PS LL LTL LP FPN GN OTR PS TX LL PS LP PS LL LTL GN OTR RG PS total ,308 1,558 1,908 1,401 2, ,328 9, ,145 11,766 24, , ,833 1,082 3,207 1, ,705 10, ,968 12,637 22, , ,070 2,256 2, ,330 5, ,186 7,680 21, ,878 1,049 6,328 1,154 2,827 2, ,334 5, ,946 28, ,266 1,223 5,158 1,250 5,021 1, ,534 6, ,343 32, ,414 1,170 2,323 1,392 2,701 1, ,542 2, ,528 23, , , ,130 2, , ,107 32, , ,479 1,777 1,644 1, , , ,077 28, , , , ,002 19, , , , , , , ,904 1,817 2, , , ,061 16, , ,714 1,086 2, , , ,063 19, , ,352 1,565 2, , ,003 15, , , , ,383 9, , , , , ,184 10, , , , , ,635 8, , , , , , , , , , , ,149 13, , , , ,917 1,138 2, , , ,155 14, , , , , , , , , , , ,700 8,439 21, ,122 1,383 1, ,054 1,814 17, , ,782 20, ,375 1,260 1, ,910 10, , ,255 12, ,439 1,155 1, , ,089 21, ,369 3,047 24, ,020 1,005 1, , ,780 22, ,025 3,999 26, ,728 1,004 1, , ,839 14, ,286 15, , ,523 13, ,714 2,125 13,333 The catch statistics for the Republic of Korea were derived from Japanese import statistics, (minimum estimates). Las estadísticas de captura de la República de Corea fueron derivadas de estadísticas de importación japonesas, (estimaciones mínimas). 2 The catch statistics for United States were categorized into commercial fishing and sport fishing during Las estadísticas de captura de Estados Unidos fueron categorizadas en pesca comercial y pesca deportiva durante
45 TABLE A-6a. Annual retained catches of North Pacific albacore by region, in metric tons. The data for the western and central Pacific Ocean were obtained from the Secretariat of the Pacific Community. TABLA A-6a. Capturas retenidas anuales de atún albacora del Pacífico Norte por región, en toneladas métricas. Los datos del Océano Pacífico occidental y central provienen de la Secretaría de la Comunidad del Pacífico. Eastern Pacific Ocean Western and central Pacific Ocean ALB Océano Pacífico oriental Océano Pacífico occidental y central (N) LL LP LTL PS OTR Subtotal LL LP LTL OTR Subtotal Total ,332 18, ,052 14,139 52, ,027 90, ,456 15, ,577 17,764 85, , , , ,960 9, ,456 16,554 31, ,712 50,254 63, ,577 16, ,961 12,762 59, ,223 79,885 99, , , ,778 13,321 44,662 2,347 4,108 64,438 71, , , ,451 14,445 46,742 2,347 4,531 68,065 75, , , ,524 17,727 27, ,287 57,238 72, , , ,440 17,007 29,614 3,410 13,632 63,663 70, , , ,905 14,746 21,098 1,833 7,586 45,263 55, ,645 1,441 8,343 3,910 1,427 17,766 13,226 26,010 1,011 17,236 57,483 75, , , ,178 8,749 13,592 20,679 1,163 13,667 49,101 57, , ,378 12,671 16, ,710 39,933 45, , , ,907 13,822 19, ,396 44,898 48, , ,447 14,026 6, ,836 39,243 44, , ,003 12,786 8, ,726 41,289 44, , , ,842 14,953 8, ,098 50,048 53, , , ,157 15,889 7, ,697 33,890 38, , , ,268 18,200 13, ,499 49,007 55, , , ,014 28,972 12,797 2,417 4,054 48,240 54, , , ,105 28,086 26,389 3,601 3,094 61,170 73, , , ,589 30,286 20,981 2,636 2,400 56,303 65, , , ,328 36,256 20,296 12,839 1,661 71,052 82, , , ,078 11,004 44,778 32,311 11,036 3,190 91, , , , ,288 16,716 44,946 23,005 7,136 3,078 78,165 94, , , ,770 19,309 41,751 50,406 2,172 8, , , , , ,853 15,408 39,342 21,520 3,737 3,387 67,986 83, , , ,729 21,050 40,342 29,707 4,770 1,851 76,670 97, , , ,387 17,213 40,411 29,587 1,909 1,803 73,710 90, , , ,227 27,024 * * * * * * , , * * * * * * * * 43
46 44 TABLE A-6b. Annual retained catches of South Pacific albacore by region, in metric tons. The data for the western and central Pacific Ocean were obtained from the Secretariat of the Pacific Community. TABLA A-6b. Capturas retenidas anuales de atún albacora del Pacífico Sur por región, en toneladas métricas. Los datos del Océano Pacífico occidental y central provienen de la Secretaría de la Comunidad del Pacífico. Eastern Pacific Ocean Western and central Pacific Ocean ALB Océano Pacífico oriental Océano Pacífico occidental y central (S) LL LTL Subtotal LL LP LTL OTR Subtotal Total ,130 * 4,130 24, ,645 29, ,009 * 2,009 22, ,346 24, ,343 * 4,343 26, ,096 31, ,282 * 12,282 26, , ,611 40, ,397 * 8,397 25, ,460 34, ,910 * 4,910 28, , ,258 35, ,908 * 4,908 29, , ,252 36, ,458 * 5,458 24, , ,536 31, ,590 * 7,590 20, ,446 29, ,010 * 5,010 17, ,773 1,589 22,140 27, ,073 * 6,073 24, ,253 1,937 29,692 35, , ,843 29, ,929 1,946 32,944 38, , ,566 18, , ,855 28, ,813 1,282 11,096 23, ,014 5,283 31,421 42, , ,252 16, ,777 21,968 46,334 52, ,871 1,336 7,207 17, ,639 7,538 30,790 37, , ,548 18, ,010 1,489 27,002 34, ,039 1,205 7,244 14, , ,042 27, , ,258 19, , ,342 40, , ,207 25, , ,077 42, , ,648 21, , ,002 36, , ,033 18, , ,586 29, , ,605 24, , ,404 34, , ,405 28, , ,916 44, , ,919 29, , ,956 38, , ,671 32, , ,826 46, , ,883 39, , ,302 55, , ,619 36, , ,801 52, , ,989 * * * * * * ,913 * * * * * * * *
47 45 TABLE A-7. Catches per cubic meter of well volume for the purse-seine fleet in the EPO, by species and vessel capacity group. All = YFT, SKJ, BET, PBF, ALB, BKJ, BZX, and TUN (see Table A-2a). TABLA A-7. Capturas por metro cúbico de volumen de bodega de la flota cerquera en el OPO, por especie y clase de arqueo del buque. All = YFT, SKJ, BET, PBF, ALB, BKJ, BZX, y TUN (ver Tabla A-2a). Species Well volume Volumen de bodega (m 3 ) <401 Especie >2100 Total 1999 YFT SKJ BET All YFT SKJ BET All YFT SKJ BET All YFT SKJ BET All YFT SKJ BET All YFT SKJ BET All
48 46 TABLE A-8. Estimated numbers of sets, by set type and vessel size class, and estimated retained catches, in metric tons, of yellowfin, skipjack, and bigeye tuna in the EPO, by purse-seine vessels. The data for 2004 are preliminary. The data for yellowfin, skipjack, and bigeye tunas have been adjusted to the species composition estimate and are preliminary. TABLA A-8. Números estimados de lances, por tipo de lance y clase de arqueo de los buques, y capturas retenidas estimadas, en toneladas métricas, de atunes aleta amarilla, barrilete, y patudo en el OPO. Los datos de 2004 son preliminares. Los datos de los atunes aleta amarilla, barrilete, y patudo fueron ajustados a la estimación de composición por especie, y son preliminares. DEL Number of sets Número de lances Class Clase Retained catch Captura retenida Total YFT SKJ BET Sets on fish associated with dolphins Lances sobre peces asociados con delfines ,286 13, , ,160 11, ,936 5, ,827 12, ,660 1, ,997 11, ,893 1, ,661 9, ,283 1, ,398 10, ,647 1, ,953 6, , ,804 7, ,486 1, ,185 7, ,180 2, ,472 7, ,595 1, ,977 9, ,308 8, ,645 10, ,734 4, ,648 8, ,297 1, ,235 9, , ,823 9, ,844 1, ,446 12, ,570 3, ,839 13, ,367 13, ,783 11, ,172 10,901 3 OBJ Sets on fish associated with floating objects Lances sobre peces asociados con objetos flotantes ,322 1,813 3,135 27,447 34, ,281 3,104 25,210 38, ,339 3,313 28,383 44,684 1, ,558 3,277 35,526 35,572 3, ,165 2,984 25,501 39,049 2, ,763 2,631 15,010 49,144 2, ,063 2,556 19,304 53,079 6, ,770 3,438 20,842 51,121 33, ,521 4,228 21,097 80,049 41, ,230 4,007 5,237 27,820 69,737 58, ,699 5,653 7,352 30, ,792 62, ,198 5,481 6,679 26, ,326 41, ,620 5,250 43, ,650 49, ,916 4,410 43, ,203 91, ,744 6,441 69, ,142 60, ,781 6,559 37, ,875 55, ,497 6,247 31, ,921 52, ,083 5,640 27, ,524 65,478
49 47 TABLE A-8. (continued) TABLA A-8 (continuación) Number of sets Número de lances Retained catch Captura retenida Class Clase Total YFT SKJ BET NOA Sets on unassociated schools Lances sobre cardúmenes no asociados ,823 3,981 5,804 46,951 28, ,147 7,536 11,683 98,147 43, ,955 5,878 8,833 57,952 48, ,683 5,397 9,080 53,832 37,447 1, ,571 3,612 7,183 50,473 21,848 2, ,010 4,079 8,089 47,463 33,876 5, ,739 6,267 12,006 88,971 30,169 3, ,440 5,064 10,504 62,081 17, ,120 4,782 10,902 61,158 44,436 3, ,807 5,118 10,925 72,191 32,486 2, ,334 4,693 10,027 62,519 28,509 1, ,700 4,631 10,331 72,897 25,323 2, ,632 6,143 11,775 95,571 78,222 1, ,119 5,482 11,601 65,240 83,639 2, ,481 3,030 7,511 81,267 19, ,008 3,409 8,417 72,931 33,594 1, ,825 5,083 12,908 90,325 79,086 1, ,050 5,699 10,749 64,463 69,486 1,463 Sets on all types of schools ALL Lances sobre todos tipos de cardumen ,202 19,080 22, ,007 64,019 1, ,019 20,977 25, ,293 87,113 1, ,962 21,044 25, ,995 94,935 2, ,433 18,952 23, ,251 74,370 5, ,390 15,438 19, ,257 62,229 4, ,904 16,240 21, ,121 84,283 7, ,266 15,283 21, ,494 83,829 9, ,113 15,638 21, ,409 70,127 34, ,827 15,488 22, , ,045 45, ,051 16,597 23, , ,976 61, ,076 19,323 26, , ,456 64, ,898 20,757 27, , ,631 44, ,262 19,411 25, , ,564 51, ,613 18,633 25, , ,240 94, ,178 18,597 23, , ,948 61, ,786 21,636 27, , ,633 57, ,575 24,419 32, , ,089 54, ,607 22,565 28, , ,911 66,944
50 48 TABLE A-9. Types of floating objects on which sets were made. The 2004 data are preliminary. TABLA A-9. Tipos de objetos flotantes sobre los que se hicieron lances. Los datos de 2004 son preliminares. OBJ Flotsam Naturales FADs Plantados Unknown Desconocido Total No. % No. % No. % , , , , , , , , , , , , , , , , , , , , , , , , , ,083
51 TABLE A-10. Reported total fishing effort for all species (E; 1000 hooks), and catch (C; metric tons) of yellowfin, skipjack, bigeye, Pacific bluefin, and albacore tunas only, by flag, by the longline fishing fleets operating in the EPO. TABLA A-10. Esfuerzo de pesca total reportado (E; 1000 anzuelos) para todas las especies, y captura (C; toneladas métricas) de aleta amarilla, barrilete, patudo, aleta azul del Pacífico, y albacora solamente, por bandera, de las flotas palangreras que faenan en el OPO. 1 LL CHN JPN KOR MEX PAN PYF TWN USA VUT E C E C E C E C E C E C E C E C E C ,134 51,566 2, ,580 1, ,301 68,895 3,931 2,043 2,364 1, ,875 83,725 10,958 5,628 11,973 7, ,006 79,320 8,571 7,012 8,743 6, ,769 67,932 5,021 2,305 3,138 2, ,141 75,639 11,788 5,907 3,000 1, ,275 59,226 19,731 6,539 5,952 2, ,200 61,370 18,612 7,488 8,117 3, ,176 69,563 14,675 6, ,850 2, ,635 57,261 11,767 4,491 3,730 1, ,758 74,348 19,785 10, ,126 1, , ,672 30,765 17, ,874 2, , ,053 36,436 19, ,267 5, ,694 82,383 43,056 10, ,567 4, ,373 84,961 43,365 4, ,360 4, , ,923 47,166 17,415 12,543 4, , ,337 65,024 24,644 17,969 5, ,284 93,011 45,634 13, ,025 14, ,955 87,977 46,375 12, , ,064 6, ,976 92,606 44,788 13, , ,588 4, ,598 69,435 54,979 12, , ,910 1, ,653 52,298 40,290 14, , ,830 3, ,383 59,325 30,493 16,663 5,490 1,941 8,720 5, ,569 50,167 51,817 15, ,415 2,858 10,586 4,834 1, ,958 32,886 54,269 13, ,190 4,446 23,247 7,774 1, ,277 45,194 33,585 18, ,230 4,382 18,152 7,809 1, , ,056 5, ,204 54,772 72,261 18, ,200 5,086 53,224 20,027 1, , ,756 10, ,572 45,346 96,273 14, ,700 3,238 77,051 31, , ,289 14, ,352 * 15, * * * * 74,322 28,227 * , * 2,602 * 18,458 * * * * * * * 19,196 * * 21 1,656 Less than 100% of the total catch and effort (KOR only) Menos del 100% de la captura y esfuerzo totales (KOR solamente) 49
52 50 TABLE A-11. Numbers and well volumes, in cubic meters, of purse-seine and pole-and line vessels of the EPO tuna fleet, The data for 2004 are preliminary. TABLA A-11. Número y volumen de bodega, en metros cúbicos, de buques cerqueros y cañeros de la flota atunera del OPO, Los datos de 2004 son preliminares. PS LP Total No. Vol. (m 3 ) No. Vol. (m 3 ) No. Vol. (m 3 ) , , , , , , , , , , , , , , , , , , , , , , , , , , , , , , , , , , , , , , , , , , , , , , , , , , , , , , , , , , , , , , , , , , , , , , , , , , , , , , , , , , , , , , ,366
53 51 TABLE A-12a. Estimates of the numbers and well volumes, in cubic meters, of purse-seine (PS) and pole-and-line (LP) vessels that fished in the EPO in 2003 by flag, gear, and size class. Each vessel is included in the total for each flag under which it fished during the year, but is included only once in the "Grand total"; therefore the grand total may not equal the sums of the individual flags. TABLA A-12a. Estimaciones del número y volumen de bodega, en metros cúbicos, de buques cerqueros (PS) y cañeros (LP) que pescaron en el OPO en 2003, por bandera, arte de pesca, y clase de arqueo. Se incluye cada buque en los totales de cada bandera bajo la cual pescó durante el año, pero solamente una vez en el Total general ; por consiguiente, los totales generales no equivalen necesariamente a las sumas de las banderas individuales. Well Flag Gear Size class Clase de arqueo volume Total Volumen Bandera Arte de bodega Number Número m 3 BLZ PS BOL PS ,910 COL PS ,259 ECU PS ,415 ESP PS ,177 GTM PS ,700 HND PS ,798 MEX PS ,633 LP PAN PS ,909 PER PS ,018 SLV PS ,377 USA PS ,665 VEN PS ,699 VUT PS ,449 UNK PS ,864 PS Grand total LP Total general Grand total Total general - : none ninguno PS + LP Well volume Volumen de bodega (m 3 ) PS ,552 5,825 9, , ,706 LP PS + LP ,789 5,825 9, , ,044
54 52 TABLE A-12b. Estimates of the numbers and well volumes, in cubic meters, of purse-seine (PS) and pole-and-line (LP) vessels that fished in the EPO in 2004 by flag, gear, and size class. Each vessel is included in the total for each flag under which it fished during the year, but is included only once in the "Grand total"; therefore the grand total may not equal the sums of the individual flags. TABLA A-12b. Estimaciones del número y volumen de bodega, en metros cúbicos, de buques cerqueros (PS) y cañeros (LP) que pescaron en el OPO en 2004, por bandera, arte de pesca, y clase de arqueo. Se incluye cada buque en los totales de cada bandera bajo la cual pescó durante el año, pero solamente una vez en el Total general ; por consiguiente, los totales generales no equivalen necesariamente a las sumas de las banderas individuales. Well Flag Gear Size class Clase de arqueo volume Total Volumen Bandera Arte de bodega Number Número m 3 BOL PS ,412 COL PS ,318 ECU PS ,128 ESP PS ,859 GTM PS ,415 HND PS ,810 MEX PS ,443 LP NIC PS ,926 PAN PS ,411 SLV PS ,377 USA PS ,178 VEN PS ,961 VUT PS ,082 UNK PS PS Grand total LP Total general Grand total Total general - : none ninguno PS + LP Well volume Volumen de bodega (m 3 ) PS ,294 6,712 9, , ,028 LP PS + LP ,531 6,712 9, , ,366
55 53 TABLE A-13. Minimum, maximum, and average values, in thousands of metric tons, for monthly capacities of purse seiners and pole-and-line vessels at sea in the EPO during l , and the 2004 values. TABLA A-13. Valores mínimos, máximos, y medios, en miles de toneladas métricas, de la capacidad mensual de buques cerqueros y cañeros en el mar en el OPO durante , y los valores de Month Mes Min Max Ave-Prom Ave-Prom
56 54 A. LA PESQUERÍA DE ATUNES Y PECES PICUDOS EN EL OCÉANO PACÍFICO ORIENTAL 1. Capturas y descargas de atunes, peces picudos, y especies asociadas Capturas por especie Distribución de las capturas de atunes Composición por tamaño de las capturas de atunes Capturas de atunes y bonitos, por bandera y arte Descargas de atunes y bonitos por buques de cerco y caña Capturas cerqueras por metro cúbico de volumen de bodega Esfuerzo Pesca de cerco Pesca palangrera Las flotas Las flotas de cerco y de caña Otras flotas del OPO...61 En esta sección se presenta un resumen de las pesquerías de las especies amparadas por la Convención de la CIAT (atunes y otras especies capturadas por buques atuneros) en el Océano Pacífico oriental (OPO). Las más importantes de éstas son los escómbridos (familia Scombridae), que incluyen los atunes, bonitos, carites y caballas. Las especies principales de atunes capturadas son el aleta amarilla, barrilete, patudo y albacora, con capturas menores de los atunes aleta azul del Pacífico y barrilete negro y de melvas; se capturan también otros escómbridos, como el bonito y el peto. El informe abarca también otras especies capturadas por buques atuneros en el OPO: peces picudos (pez espada, marlines y pez vela), carángidos (jureles y salmón), dorado, elasmobranquios (tiburones y rayas) y otros peces. La mayor parte de las capturas es realizada por las flotas de cerco y palangrera; la flota cañera y varias pesquerías artesanales y deportivas toman un pequeño porcentaje de las capturas totales. Se dispone de datos detallados de las pesquerías cerquera y cañera; los datos de las pesquerías palangreras, artesanales y deportivas son menos completas. El Registro Regional de Buques de la CIAT contiene detalles de los buques autorizados para pescar atunes en el OPO. La CIAT cuenta con registros detallados de la mayoría de los buques cerqueros y cañeros que pescan atunes aleta amarilla, barrilete, patudo y/o aleta azul del Pacífico en el OPO. El Registro es incompleto para buques pequeños. Incluye los buques palangreros grandes (>24 m) de algunas naciones que pescan en el OPO y en otros océanos. Se agrupa a los buques cerqueros en seis clases de tamaño, por su capacidad de acarreo en metros cúbicos (m 3 ) de volumen de bodega: Clase Volumen (m 3 ) < >425 Los datos en el presente informe provienen de varias fuentes, entre ellas los cuadernos de bitácora de los buques, datos de observadores, registros de descargas provistos por empresas enlatadoras y otros procesadores, registros de importaciones y exportaciones, estimaciones derivadas del programa de muestreo de especies y composición por talla, informes de los gobiernos y otras entidades, e informes publicados. 1. CAPTURAS Y DESCARGAS DE ATUNES, PECES PICUDOS, Y ESPECIES ASOCIADAS Estimar la captura total de una especie de pez es difícil, por varios motivos. Pescado es descartado en el mar, y los datos de algunas artes de pesca son a menudo incompletos. Desde 1993 los observadores han tomado datos sobre pescado descartado en el mar por buques cerqueros de la Clase 6. Esta información permite una estimación más precisa de las cantidades totales de pescado capturadas por la flota de cerco. Las estimaciones de la cantidad total de la captura que se descarga (en lo sucesivo la captura retenida ) se basan principalmente en datos de descarga. A partir del presente informe, los datos de descargas de buques cerqueros y cañeros son ajustados con base en las estimaciones de composición por especies para los atunes aleta amarilla, barrilete, y patudo. El programa actual de muestreo de composición por especies, descrito en la Sección 1.3.1, comenzó en 2000, y por lo tanto los datos de captura de son ajustados con base en las estimaciones obtenidas para cada año, por bandera. Para ajustar los datos de captura de los años previos, se aplicó la proporción media de especies de las estimaciones de , por bandera, y se sumó para todas las banderas. En general, esto ha incrementado las capturas estimadas de patudo, y reducido aquéllas de aleta amarilla y barrilete. Todos estos ajustes son preliminares, y
57 55 podrían ser mejorados en el futuro. Todos los datos de 2004 de capturas y descargas de la flota cerquera y cañera son provisionales. Se obtienen los datos de las capturas retenidas de la mayoría de los buques palangreros grandes de los gobiernos de las naciones que pescan atunes en el OPO. Los buques palangreros, particularmente los más grandes, dirigen su esfuerzo principalmente hacia los atunes patudo, aleta amarilla, y albacora, o el pez espada. Los datos de los buques palangreros pequeños, artesanales y otros que pescan atunes, peces picudos, dorado, y tiburones en el OPO fueron obtenidos directamente de los gobiernos, de los cuadernos de bitácora, o de informes publicados por los gobiernos. Los datos del Pacífico occidental y central (WCPO) fueron provistos por el Programa de Pesquerías Oceánicas de la Secretaría de la Comunidad del Pacífico (SPC). Todos los datos de palangre y otras artes de 2003 y 2004 son preliminares. Los datos de todas estas fuentes fueron compilados en una base de datos por el personal de la CIAT y resumidos en el presente informe. En los últimos años, el personal de la CIAT ha incrementado sus esfuerzos por compilar datos sobre las capturas de atunes, peces picudos, y otras especies capturadas con otras artes, como curricán, arpón, y red de transmalle, y artes deportivas. En la Tabla A-1 se presentan las capturas totales de aleta amarilla, barrilete, y patudo en el Océano Pacífico entero, estimadas de todas las fuentes mencionadas; son tratadas en mayor detalle en las secciones siguientes. En la Tabla A-2 se presentan estimaciones de las capturas anuales retenidas y descartadas de atunes y otras especies capturadas por buques atuneros en el OPO durante En las Tablas A-3a-e se presentan las capturas de atunes y bonitos por todas las artes durante , por arte y bandera, y en las Tablas A-4a-b se resumen por bandera las capturas y descargas cerqueras y cañeras de atunes y bonitos durante No se restringió la pesca del atún en el OPO durante , pero las capturas de la mayoría de las especies fueron afectadas por las restricciones de la pesca durante partes de, o todo, el segundo semestre del año durante Además, la reglamentación de aquellos cerqueros que dirigen su esfuerzo hacia atunes asociados con delfines afectó el modo de operación de esos buques, especialmente desde fines de los años 1980 (ver Sección 3). Las capturas fueron afectadas también por perturbaciones climáticas, tales como los importantes eventos de El Niño que ocurrieron durante y Estos redujeron la vulnerabilidad de los peces a la captura con red de cerco debido a la mayor profundidad de la termoclina, pero aparentemente no tuvieron ningún efecto sobre las capturas palangreras. El reclutamiento de aleta amarilla suele ser mayor después de un evento de El Niño. En la Sección J.5, Ambiente físico, se comentan en mayor detalle los efectos de los eventos de El Niño y otras condiciones ambientales sobre la pesca en el OPO Capturas por especie Atún aleta amarilla En la Tabla A-1 y la Figura B-1 se presentan las capturas anuales de aleta amarilla durante En general, las capturas han aumentado durante este período en el OPO y en el Pacífico occidental y central. En el OPO, el Niño de causó una reducción de las capturas en esos años, pero las capturas en el resto del Pacífico aparentemente no fueron afectadas. Aunque el alcance del Niño de fue mayor, no tuvo el mismo efecto sobre las capturas de aleta amarilla en el OPO. En el Pacífico occidental y central alcanzaron 350 mil toneladas (t) en 1990 y un pico de 466 mil t en 1998, y siguieron altas hasta 2003 (no se dispone todavía de datos de 2004 para esa región). Las capturas fueron altas en el Pacífico entero durante En el OPO, la captura de aleta amarilla en 2002, 440 mil t, estableció un récord, pero en 2004 disminuyó sustancialmente. En la Tabla A-2a se presentan las capturas retenidas anuales de aleta amarilla en el OPO por buques cerqueros y cañeros durante La captura retenida anual media durante fue 276 mil t (rango: 212 a 413 mil t); la estimación preliminar de la captura retenida en 2004, 270 mil t, fue un 29% menor que en 2003, y un 2% inferior al promedio de Los descartes medios de aleta amarilla en el mar durante se cifraron en un 2% (rango: 1 a 3%) de la captura total cerquera (capturas retenidas más descartes) de la especie (Tabla A-2a). En la Tabla A-2a se presentan las capturas retenidas anuales de aleta amarilla en el OPO por buques palangreros durante Durante fueron relativamente estables, con un promedio de unas 22 mil t (rango: 11 a 35 mil t), o un 7% de las capturas retenidas totales de la especie. El aleta amarilla es capturado también por buques de pesca deportiva, incidentalmente en redes de transmalle, y en pesquerías artesanales. En la columna de Otras artes (OTR) de la Tabla A-2a se presentan estimaciones de estas capturas; durante fueron en promedio unas 2 mil t. En la Sección B del presente informe se presenta mayor información sobre el atún aleta amarilla Atún barrilete En la Tabla A-1 y la Figura C-1 se presentan las capturas anuales de barrilete durante La mayoría de la captura de barrilete en el Pacífico proviene del Pacífico occidental y central. La mayor captura anual registrada en esa región, 1,3 millones de toneladas, ocurrió
58 56 en 1998, mientras que la captura récord en el OPO, 296 mil t, ocurrió en En la Tabla A-2a se presentan las capturas retenidas anuales de barrilete en el OPO por buques cerqueros y cañeros durante La captura retenida anual media durante fue 138 mil t (rango: 64 a 276 mil t). La estimación preliminar de la captura retenida de barrilete en 2004 es de 197 mil t, un 43% más que el promedio de , pero un 28% menos que la captura récord de Los descartes medios anuales de barrilete en el mar durante se cifraron en un 11% (rango: 7 a 19%) de la captura total de la especie (Tabla A-2a). Se capturan pequeñas cantidades de barrilete con palangre y otros tipos de arte (Tabla A-2a). En la Sección C del presente informe se presenta mayor información sobre el atún barrilete Atún patudo En la Tabla A-1 y la Figura D-1 se presentan las capturas anuales de patudo durante En general, las capturas en el OPO y en el Pacífico occidental y central han aumentado, pero con fluctuaciones considerables. Las capturas en el OPO alcanzaron 100 mil t en 1986, y desde entonces han fluctuado entre unas 70 y 125 mil t, con la mayor captura reportada en En el Pacífico occidental y central, las capturas de patudo aumentaron a más de 85 mil t a fines de la década de 1970, disminuyeron en los años 1980, y luego aumentaron, con fluctuaciones menores, hasta 1999, cuando llegaron a más de 110 mil t. La captura récord de patudo en esa región, unas 115 mil t, ocurrió en Antes de 1994 la captura retenida media anual de patudo por buques cerqueros en el OPO fue alrededor de 9 mil t (rango: 1 a 22 mil t) (Tabla A-2a). Con el desarrollo de dispositivos agregadores de peces (plantados) colocados en el agua por los pescadores para atraer atunes, las capturas retenidas anuales de patudo aumentaron a 35 mil t en 1994 a entre 44 y 64 mil t durante , y a un récord de 94 mil t en La estimación preliminar de la captura retenida en el OPO en 2004 es de 67 mil t. Los descartes medios anuales de patudo en el mar durante se cifraron en un 5% de la captura cerquera de la especie (rango: 1 a 9%). Los buques cañeros capturaron pequeñas cantidades de patudo (Tabla A-2a). Durante el período de , antes del incremento en el uso de plantados y las mayores capturas cerqueras de patudo resultantes, las capturas palangreras constituían, en promedio, un 88% de las capturas retenidas de esta especie en el EPO. Entre 1994 y 2003 las capturas anuales retenidas de las pesquería palangreras oscilaron entre unas 36 y 73 mil t (promedio: 56 mil t), en promedio un 48% de la captura total de patudo en el OPO (Tabla A-2a). La estimación preliminar de la captura en el OPO en 2004 es de 40 mil t (Tabla A-2a). Se capturan pequeñas cantidades de patudo con otros tipos de arte (Tabla A-2a). En la Sección D del presente informe se presenta mayor información sobre el atún patudo Atún aleta azul En la Tabla A-5 y la Figura E-1 se presentan las capturas de aleta azul del Pacífico en el Océano Pacífico entero, por bandera y arte. Los datos, obtenidos del Comité Científico Internacional sobre los Atunes y Especies Afines en el Océano Pacífico Norte (ISC) y son desglosados por nación o entidad pesquera, sin tener en cuenta la región del Pacífico donde fue capturado el pescado. En la Tabla A-2a se presentan las capturas de atún aleta azul del Pacífico en el OPO durante , por arte de pesca. Durante la captura anual retenida de la especie en el OPO por buques cerqueros y cañeros fue en promedio 2 mil t (rango: 400 t a 8 mil t). La estimación preliminar de la captura retenida de aleta azul en 2004, 9 mil t, es cuatro veces el promedio de Pequeñas cantidades de aleta azul son descartadas en el mar por buques cerqueros (Tabla A-2a). En la Sección E del presente informe se presenta información sobre el atún aleta azul del Pacífico Atún albacora En las Tablas A-6a-b se presentan las capturas de albacora en el Océano Pacífico entero, por arte y zona (al norte y al sur de la línea ecuatorial y al este y oeste de 150 O), y en las Figuras F-1a-b las capturas al norte y al sur de la línea ecuatorial (pero no al este y oeste de 150 O). En la Tabla A-2a se presentan las capturas de albacora en el OPO, por arte de pesca. Una porción importante de la captura de la especie es tomada con curricán, incluido en otras artes (OTR) en la Tabla A-2a. Los datos de capturas fuero obtenidos de datos de la CIAT en el caso del OPO, y de datos compilados por la SPC en el caso del Pacífico occidental y central. En la Sección F del presente informe se presenta información sobre el atún albacora.
59 Otros atunes y especies afines Los atunes aleta amarilla, barrilete, y patudo forman el componente más importante de las capturas retenidas de la flota cerquera y cañera en el OPO, pero otros atunes y especies afines, como el barrilete negro, bonito, peto, y las melvas, contribuyen a la captura general de la región. En la Tabla A-2a se presentan estimaciones de las capturas anuales retenidas y descartadas de estas especies durante Las capturas incluidas en la categoría de atunes no identificados (TUN) en la Tabla A-2a contienen algunas capturas reportadas por especie (melvas o petos) junto con los atunes no identificados. La captura retenida total de estas otras especies en estas pesquerías fue de unas mil toneladas en 2004, menos que el promedio de de unas 4 mil t (rango: 1 a 15 mil t). El barrilete negro es también capturado con otras artes en el OPO, principalmente en la pesca artesanal costera. El bonito es asimismo capturado en las pesquerías artesanales, y ha sido reportado como captura por buques palangreros en algunos años Peces picudos En la Tabla A-2b y las Figuras G-1, H-1 e I-1 se presentan datos de captura de los peces picudos (pez espada, marlín azul, negro, rayado y trompa corta, y pez vela). El pez espada es capturado en el OPO con palangres a gran escala y artesanales, red de transmalle, arpón y, de vez en cuando, por buques deportivos. La captura palangrera anual media de pez espada durante fue 9 mil t, pero durante fue más de 15 mil t. No queda claro si esto se debe a un aumento del esfuerzo dirigido hacia la especie. Los demás peces picudos son capturados con palangres a gran escala y artesanales y por artes deportivas. Las capturas palangreras anuales medias de marlín azul y marlín rayado durante fueron unas 5 mil y 3 mil t, respectivamente. Se capturan cantidades menores de otros peces picudos con palangre. Desgraciadamente, se cuenta con muy poca información sobre las capturas deportivas de peces picudos, pero se cree que son sustancialmente menores que las capturas comerciales de todas estas especies. Se capturan pequeñas cantidades de peces picudos con red de cerco, pero se consideran éstas descartadas, aunque es posible que parte de esta captura sea descargada sin ser reportada. Se incluyen estos datos en la Tabla A-2b. En las Secciones G-I del presente informe se presenta información sobre las poblaciones del pez espada, marlín azul, y marlín rayado Otras especies En la Tabla A-2c se presentan datos de las capturas y descartes de carángidos (jureles y salmón), dorado, elasmobranquios (tiburones y rayas) y otros peces capturados en el OPO. Las capturas de dorado son descargadas principalmente en puertos de América Central y del Sur. Aunque en algunos años se capturas más que 10 mil t de la especie, rara vez se informa del tipo de arte Distribución de las capturas de atunes Capturas cerqueras En las Figuras A-1a, A-2a, y A-3a ilustran las distribuciones anuales medias de las capturas de aleta amarilla, barrilete y patudo, por tipo de lance, por buques cerqueros en el OPO durante ( en el caso del patudo), y en las Figuras A-1b, A-2b, y A-3b estimaciones preliminares para Las capturas de aleta amarilla fueron significativamente menores en las zonas del norte frente a México y Centroamérica en Las distribución de las capturas de barrilete en 2004 fue similar a las de , aunque las capturas en las zonas costeras de México fueron mayores, debido posiblemente a cambios en la estrategia de pesca motivados por la mala pesca de aleta amarilla. No se captura a menudo patudo al norte de aproximadamente 7 N. Las capturas de la especie disminuyeron en las zonas costeras de América del Sur en Con el desarrollo de la pesquería sobre plantados, arriba descrita, la importancia relativa de las zonas cerca de la costa ha disminuido, mientras que la de las zonas de altura ha aumentado Capturas palangreras Las bases de datos de la CIAT contienen datos sobre las distribuciones espacial y temporal de las capturas en el OPO de las flotas palangreras de aguas lejanas de China, la República de Corea, España, Estados Unidos, Japón, Polinesia Francesa, Taipei Chino, y Vanuatu. Los atunes patudo y aleta amarilla forman la mayor parte de las capturas de la mayoría de estos buques. En la Figura A-4 se ilustra la distribución de las capturas de atunes de estas dos especies por buques palangreros japoneses en el Océano Pacífico durante Se presentan datos de la pesquería palangrera japonesa en el OPO durante en los Boletines de la CIAT que describen esa
60 58 pesquería Composición por tamaño de las capturas de atunes Capturas de las pesquerías cerquera, cañera y deportiva Las muestras de frecuencia de talla son la fuente básica de los datos usados para estimar la composición por talla y edad de las distintas especies de peces en las descargas. Esta información es necesaria para obtener estimaciones de la composición de las poblaciones por edad, usadas para varios propósitos, entre ellos el modelado integrado que el personal ha usado en los últimos años. Los resultados de estudios de este tipo han sido descritos en diversos Boletines de la CIAT, en sus Informes Anuales desde 1954, y en sus Informes de Evaluación de Poblaciones. Las muestras de frecuencia de talla de aleta amarilla, barrilete, patudo, aleta azul del Pacífico y, ocasionalmente, barrilete negro de las capturas de buques cerqueros, cañeros, y deportivos en el OPO son tomadas por el personal de la CIAT en puertos de descarga en Ecuador, Estados Unidos, México, Panamá, y Venezuela. El muestreo de las capturas de aleta amarilla y barrilete fue iniciado en 1954, el de aleta azul en 1973, y el de patudo en 1975, y continúa actualmente. En el Informe Anual de la CIAT de 2000 y el Informe de Evaluación de Stocks 4 de la CIAT se describen los métodos de muestreo de las capturas de atún. En breve, se selecciona para el muestreo pescado en las bodegas de buques cerqueros y cañeros solamente si todo el pescado en la bodega fue capturado durante un solo mes, en un solo tipo de lance (delfín, objeto flotante, o no asociado), y en la misma zona de muestreo. Se clasifican estos datos por pesquería (Figura A-5), con base en las evaluaciones más recientes de las poblaciones realizadas por el personal. En este informe se presentan datos de peces capturados durante Para cada especie, excepto el aleta azul, se presentan dos histogramas de frecuencia de talla: el primero presenta los datos por estrato (arte de pesca, tipo de lance, y zona) para 2004, y el segundo ilustra los datos combinados para cada año del período de En el caso del aleta azul, se ilustran las capturas comerciales y deportivas de combinadas. En 2004 se obtuvieron muestras de 496 bodegas (incluyendo 10 de barcos deportivos). Hubo muy poca captura por buques cañeros en 2004, y se obtuvo solamente una muestra de los mismos. Para la evaluación de las poblaciones de aleta amarilla se definen nueve pesquerías de cerco (cuatro asociadas con objetos flotantes, tres asociadas con delfines, dos de atunes no asociados) y una de caña (Figura A-5). La última abarca todas las 13 zonas de muestreo. De las 496 bodegas muestreadas, 379 contenían aleta amarilla. En la Figura A-6a se ilustran las composiciones por talla estimadas del pescado capturado durante La mayoría de la captura de aleta amarilla provino de lances sobre atunes asociados con delfines. Los peces de mayor tamaño (>100 cm) fueron capturados principalmente durante el primer semestre del año, y los de <100 cm principalmente en el segundo semestre. Sin embargo, fue evidente una moda de aleta amarilla pequeño (<60 cm) en la pesquería no asociada del Sur durante el segundo trimestre. Estos peces pequeños estuvieron presentes también en la pesquería no asociada del Norte y en todas las pesquerías sobre objetos flotantes. Fueron capturadas pequeñas cantidades de aleta amarilla en las pesquerías sobre objetos flotantes durante todo el año. Las capturas de los buques cañeros fueron insignificantes. En la Figura A-6b se ilustra la composición por talla estimada del aleta amarilla capturado por todas las pesquerías combinadas durante El peso medio del aleta amarilla capturado en 2004 fue el más bajo desde La mayor parte del aleta amarilla de >10 kg fue capturada durante el primer semestre de La moda entre 80 y 100 cm fue el grupo de tamaño predominante durante todos los trimestres excepto el segundo. Para la evaluación de las poblaciones de barrilete se definen siete pesquerías de cerco (cuatro asociadas con objetos flotantes, dos de atunes no asociados, una asociada con delfines) y una de caña (Figura A-5). Las dos últimas abarcan todas las 13 zonas de muestreo. De las 496 bodegas muestreadas, 328 contenían barrilete. En la Figura A-7a se ilustran las composiciones por talla estimadas del pescado capturado durante La mayoría de la captura de barrilete durante el primer semestre de 2004 provino de lances no asociados y sobre objetos flotantes en la zona Sur. Durante el trimestre las capturas de barrilete aumentaron en la zona Norte. Durante el tercer trimestre, la mayor parte de la captura de barrilete provino de la zona Norte, aunque las capturas aumentaron en la pesquería sobre objetos flotantes en la zona Ecuatorial también. Las capturas de barrilete en esta última pesquería siguieron aumentando durante el cuarto trimestre, y se volvió a capturar pescado en las dos pesquerías del Sur. Las tres modas de peces evidentes en la pesquería no asociada del Norte fueron capturadas en tres trimestres distintos: los peces más grandes en el tercer trimestre, los más pequeños en el cuarto, y los medianos en el segundo. El barrilete tomado en la pesquería asociada con delfines fue capturado principalmente durante el segundo trimestre. Los buques cañeros capturaron cantidades insignificantes de barrilete. En la Figura A-7b se ilustra la composición por talla estimada del barrilete capturado por todas las pesquerías combinadas durante Los peces más pequeños (40-50 cm) fueron capturados principalmente en los trimestres primero y cuarto de 2004, y los más grandes
61 59 (>55 cm) principalmente en el segundo trimestre de ese año. Para la evaluación de las poblaciones de patudo se definen seis pesquerías de cerco (cuatro asociadas con objetos flotantes, una de atunes no asociados, una asociada con delfines) y una de caña (Figura A-5). Las tres últimas abarcan todas las 13 zonas de muestreo. De las 496 bodegas muestreadas, 118 contenían patudo. En la Figura A-8a se ilustran las composiciones por talla estimadas del pescado capturado durante En 2000 la mayor parte de la captura provino de lances sobre objetos flotantes en la zona Ecuatorial, pero desde 2001 hasta 2003 provino de lances sobre objetos flotantes en la zona Sur. En 2004 las pesquerías sobre objetos flotantes en las zonas Norte, Ecuatorial, y Sur capturaron cantidades casi iguales de patudo. Se capturaron cantidades insignificantes de patudo en lances no asociados, en lances sobre objetos flotantes en la zona Costera, y en lances sobre atunes asociados con delfines. No se registró captura de patudo por barcos cañeros. En la Figura A-8b se ilustra la composición por talla estimada del patudo capturado por todas las pesquerías combinadas durante El peso medio del pescado fue máximo en 2000, cuando se logró la mayor captura de patudo jamás registrada. Desde 2002 el peso promedio del patudo ha sido bastante constante. Los patudos pequeños (40-60 cm) fueron capturados principalmente durante el segundo semestre de 2004, mientras que la mayoría de los peces más grandes fue capturada durante el cuarto trimestre. El aleta azul del Pacífico es capturado con red de cerco y con artes deportivas frente a California y Baja California, entre 23 N y 35 N, aproximadamente, principalmente entre mayo y octubre. Durante 2004 fue capturado entre 26 N y 31 N desde mayo hasta agosto. La mayor parte de las capturas comerciales y deportivas fue lograda en julio y agosto. Previamente se reportaban las capturas comercial y deportiva por separado, pero en 2004 se obtuvieron solamente 10 muestras de barcos deportivos y 14 de buques comerciales (del total de 496 muestras de 2004), imposibilitando la estimación de capturas y composición por talla por separado. Se combinaron por tanto las capturas comercial y deportiva de aleta azul para cada año del período de En la Figura A-9 se presentan las composiciones por talla estimadas. La captura comercial (8.548 t) fue mucho mayor que la deportiva (53 t), pero esta última estimación es muy preliminar. El barrilete negro es capturado incidentalmente por pescadores que dirigen su esfuerzo hacia los atunes aleta amarilla, barrilete, y patudo. La demanda de la especie es baja, y la mayoría de la captura es desechada en el mar, pero a veces se retienen pequeñas cantidades, mezcladas con las especies más deseadas. Ya que se tomó solamente una muestra de barrilete negro de las 496 bodegas muestreadas durante 2004, no se presentan en este informe histogramas de frecuencia de talla para esta especie Capturas palangreras En las Figuras A-10 y A-11 se ilustra la composición estimada por talla de las capturas de aleta amarilla y patudo por la pesquería palangrera japonesa en el OPO durante El peso promedio de ambas especies en dicha pesquería ha sido la misma durante toda su historia. En los Boletines de la CIAT que describen esta pesquería se presenta información sobre la composición por talla del pescado capturado en el OPO durante Capturas de atunes y bonitos, por bandera y arte En las Tablas A-3a-e se detallan las capturas retenidas anuales de atunes y bonitos en el OPO durante , clasificadas por bandera y arte. Las tablas incluyen todas las capturas conocidas de atunes, compiladas de registros obtenidos de gobiernos, compañías procesadoras de pescado, cuadernos de bitácora, y registros de importaciones y exportaciones. En el sitio web de la CIAT se presenta información similar de años anteriores a 2000 sobre los atunes y bonitos, y datos históricos de atunes, peces picudos, tiburones, carángidos, dorado, y peces misceláneos. En las Tablas A-4a-b (recuadro superior) se resumen las capturas cerqueras y cañeras de atunes y bonitos en 2003 y 2004, por bandera Descargas de atunes y bonitos por buques de cerco y caña Las descargas representan pescado descargado de buques pesqueros en el año correspondiente, sin tener en cuenta el año de captura. El país de descarga es aquél en el cual el pescado fue descargado o, en el caso de transbordos, el que recibió el pescado transbordado. Datos de descarga preliminares de 2003 y 2004 (Tablas A-4a-b, recuadro inferior) señalan que, de las 563 mil t de atunes y bonitos descargadas en 2003, el 49% fue descargado en Ecuador y el 25% en México. Otros países con descargas importantes de atunes y bonitos capturados en el OPO incluyeron Colombia (11%) y Costa Rica y Venezuela (4% cada uno). Es importante notar que cuando se disponga de información final, las descargas asignadas ahora a varios países podrían cambiar debido a la exportación de pescado almacenado a procesadoras en otros países Capturas cerqueras por metro cúbico de volumen de bodega En la Tabla A-7 se presenta la captura retenida total en el OPO, por metro cúbico de volumen de bodega (C/m 3 ) de los buques cerqueros que pescan atunes en el OPO, por clase de arqueo y especie, durante Para que este índice sea más detallado de lo que es

62 60 posible con las seis clases de arqueo usadas históricamente por la CIAT, se clasifica la flota en ocho clases de arqueo. La C/m 3 de los buques mayores consiste principalmente de aleta amarilla, barrilete, y patudo, mientras que las otras especies de atunes, como el barrilete negro, forman una parte importante de la C/m 3 de los buques más pequeños en muchos años. 2. ESFUERZO 2.1. Pesca de cerco Los atunes son capturados con redes de cerco en tres tipos de cardúmenes: asociados con delfines, con objetos flotantes (naturales y plantados), y no asociados con nada excepto otros peces. En la Tabla A-8 se presentan estimaciones del número de lances cerqueros de cada tipo en el OPO durante y de las capturas retenidas de esos lances (figura). Se calcularon las estimaciones para los buques de las Clases 1 a 5 con datos de bitácora en la base de datos estadística de la CIAT, y aquéllos para los buques de la Clase 6 a partir de las bases de datos de observadores de la CIAT y de los programas de observadores de la CIAT, Ecuador, Estados Unidos, México, la Unión Europea y Venezuela. El número de lances sobre atunes asociados con objetos flotantes y no asociados fue máximo entre mediados de los años 1970 y principios de los A pesar de la oposición a la pesca de atunes asociados con delfines, y de la decisión de las enlatadoras de EE.UU. de no comprar atún capturado en viajes en los cuales se realizaron lances sobre delfines, el número de lances sobre delfines disminuyó tan sólo moderadamente a mediados de los años 1990, y en 2003 fue el mayor jamás registrado. Hay dos tipos de objetos flotantes, los naturales (que también incluyen desperdicios y otros objetos artificiales), que se encuentran en el mar por casualidad, del punto de vista de los pescadores, y los que son construidos por pescadores con el propósito específico de atraer peces. Se conocen estos últimos como dispositivos agregadores de peces (DAP), plantados, o FAD (del inglés fish-aggregating device). Hace unos diez años que se usan extensamente los plantados, y su importancia relativa ha aumentado en ese período, mientras que la de los objetos naturales ha disminuido, tal como indican los datos en la Tabla A Pesca palangrera En la Tabla A-10 se presentan el esfuerzo, en número total de anzuelos, dirigido hacia todas las especies, y las capturas anuales reportadas de las especies principales de atunes por los buques palangreros en el OPO. Los datos de China, Estados Unidos, Japón, Polinesia Francesa, la República de Corea ( solamente), y Taipei Chino representan la captura y el esfuerzo totales, mientras que aquéllos de México, Panamá, la República de Corea ( ), y Vanuatu, que fueron compilados de datos de bitácora, no representan los totales. 3. LAS FLOTAS 3.1. Las flotas de cerco y de caña La CIAT mantiene registros detallados del arte de pesca, bandera, y capacidad de acarreo de la mayoría de los buques que pescan atunes aleta amarilla, barrilete, patudo, y/o aleta azul del Pacífico con red de cerco o caña en el OPO. La flota aquí descrita incluye buques cerqueros y cañeros que pescaron estas cuatro especies en el OPO durante el año entero o parte del mismo. Históricamente, se usaron las estimaciones de la capacidad de acarreo de buques individuales provistas por el armador o astillero, en toneladas de pescado, hasta que los registros de descarga indicasen que era preciso Capturas cerqueras de atunes, por especie y tipo de lance, modificarlas. Se agruparon los buques, de acuerdo a su capacidad de acarreo, originalmente en toneladas cortas y luego en toneladas métricas, en seis clases de capacidad. Desde hace varios años el personal de la CIAT usa el volumen de bodegas, en metros cúbicos (m 3 ), en lugar de peso, en toneladas (t), para medir la capacidad de acarreo de los buques. Ya que la densidad de carga de pescado en una bodega puede variar, medir la capacidad de acarreo en peso es subjetivo, ya que un cargamento de pescado metido en una bodega a densidad alta pesa más que uno cargado a densidad menor. El uso de volumen como medida de capacidad elimina este problema.


63 61 El personal de la CIAT comenzó a reunir datos sobre la capacidad en volumen en 1999, pero todavía no ha obtenido esta información para todos los buques. En el caso de buques para los cuales no se dispone de información fidedigna sobre el volumen de bodega, se convirtió la capacidad estimada en toneladas en metros cúbicos. Hasta aproximadamente 1960 predominaron en la pesca atunera en el OPO los buques cañeros, que faenaban en zonas costeras y cerca de islas y bancos de alta mar. Hacia fines de los años 1950 y a principios de los 1960, la mayoría de los buques cañeros grandes fue convertida a arte de cerco, y para 1961 este arte predominaba en la pesquería del OPO. Entre 1961 y 2004 el número de buques cañeros se redujo de unos 93 a 3, y su volumen total disminuyó de unos m 3 a unos 300. Durante el mismo período el número de cerqueros aumentó de 125 a 215, y su volumen total de bodega de unos m 3 a m 3, un promedio de unos 958 m 3 por buque. Previamente ocurrió un pico en el número y volumen total de Capacidad de acarreo, en metros cúbicos de volumen de bodega, de las flotas cerquera y cañera en el OPO, bodega de la flota cerquera entre mediados de los años 1970 y principios de los 1980, cuando llegó a haber 282 buques, y el volumen total de bodega alcanzó unos m 3, un promedio de unos 693 m 3 por buque (Tabla A-11 y figura). Las tasas de captura en el OPO fueron bajas durante , debido a la concentración del esfuerzo de pesca sobre peces pequeños, y la situación se vio agravada por un evento importante de El Niño que comenzó a mediados de 1982 y persistió hasta fines de 1983, y que causó que los peces fueran menos vulnerables a la captura. Luego disminuyó el volumen total de bodegas, debido al retiro de buques o a su traslado a otras zonas de pesca, principalmente el Pacífico occidental, y en 1984 alcanzó el nivel más bajo desde 1971, unos m 3. A principios de 1990 la industria enlatadora de Estados Unidos decidió no comprar más atún capturado en viajes en los que se pescaran atunes asociados con delfines. Esto llevó a que muchas embarcaciones de Estados Unidos abandonasen el OPO, y a una disminución consecuente en la flota a m 3 en Con la mayor participación de buques de otras naciones en la pesquería, el volumen total de bodega ha aumentado progresivamente desde 1992, y en 2004 fue de unas m 3. En las Tablas A-12a-b se presentan los datos finales de 2003 y preliminares de 2004 del número y volumen total de bodega de los buques cerqueros y cañeros que pescaron atunes en el OPO. En 2004 predominaron las flotas de México (25% del volumen total de bodega) y Ecuador (24%), seguidos por Venezuela (15%), Panamá (13%), y Colombia, España y Estados Unidos (4% cada uno). Buques de la Clase 6 formaron un 91% del volumen total de bodega de la flota cerquera en el OPO durante En la figura se compara la capacidad acumulativa en el mar durante 2004 con los cuatro años anteriores. En la Tabla A-13 se presentan los valores mensuales medios, mínimos, y máximos del volumen total de bodega en el mar (VEM), en miles de m 3, de los buques cerqueros y cañeros que pescaron atunes en el OPO durante , junto con los valores de Los valores mensuales son los promedios de las estimaciones de la VEM calculadas semanalmente por el personal de la CIAT. La pesca fue reglamentada en algunos de los últimos cuatro meses del año durante , por lo que los valores de la VEM para septiembrediciembre de 2004 no son comparables con los valores medios del período correspondiente durante Los valores del VEM en 2004 rebasaron los valores máximos de en cada mes. Durante y 2004 el valor medio del VEM fue 96 mil m 3 (58% de la capacidad total) y 129 mil m 3 (63% de la capacidad total), respectivamente Otras flotas del OPO El Registro Regional de Buques de la CIAT, disponible en el sitio web de la Comisión, contiene información sobre otros tipos de buques que pescan atunes en el OPO. El Registro es incompleto para buques pequeños; incluye registros de buques palangreros grandes (>24 m) de algunas naciones que pescan en el OPO y en otras zonas. Capacidad acumulativa de la flota cerquera y cañera en el mar, por mes,
64 62 B. YELLOWFIN TUNA An age-structured, catch-at-length analysis (A-SCALA) was used to assess yellowfin tuna in the eastern Pacific Ocean (EPO). The analysis method is described in IATTC Bulletin, Vol. 22, No. 5, and readers are referred to that report for technical details. For further information on the most recent assessment, see IATTC Stock Assessment Report 6, available on the IATTC web site. The assessment reported here is based on the assumption that there is a single stock of yellowfin tuna in the EPO. Yellowfin are distributed across the Pacific Ocean, but the bulk of the catch is made in the eastern and western parts of that ocean. The purse-seine catches of yellowfin tuna are less in the vicinity of the western boundary of the EPO (Figure A-1). The movements of tagged yellowfin tuna are generally over hundreds, rather than thousands, of kilometers, and exchange between the eastern and western Pacific Ocean appears to be limited. This is consistent with longline catch per unit of effort (CPUE) trends, which differ among areas. It is likely that there is a continuous stock throughout the Pacific Ocean, with exchange of individuals at a local level, although there is some genetic evidence for local isolation. Movement rates between the EPO and the western Pacific could not be estimated with currently available tagging data. The stock assessment requires substantial amounts of information, including data on retained catches, discards, fishing effort, and the size compositions of the catches from the various fisheries. Assumptions have been made about processes such as growth, recruitment, movement, natural mortality, fishing mortality, and stock structure. The assessment for 2005 differs from that of 2004 in the following ways. The catch and length-frequency data for the purse-seine and pole-and-line fisheries have been updated to include new data for 2004 and revised data for The effort data for these fisheries have been updated to include new data for 2004 and revised data for The catch data for the Japanese longline fisheries have been updated for , and new data for 2003 have been added. The catch data for the longline fisheries of Chinese Taipei have been updated to include new data for The catch data for the longline fisheries of China have been updated to include new data for 2003 and revised data for 2001 and The longline catch-at-length data for have been updated, and new data for 2003 have been added. The longline effort data have been standardized by means of a generalized linear model standardization of the CPUE, using data for , rather than the neural network that was used previously. The growth model likelihood has been adjusted to account for sampling at length, rather than assuming random sampling. The catch data are shown in Figure B-1. Significant levels of fishing mortality have been observed in the yellowfin tuna fishery in the EPO (Figure B-2). These levels are greatest for middle-aged yellowfin. Both recruitment (Figure B-3) and exploitation have had substantial impacts on the yellowfin biomass trajectory (Figure B-4). Most of the yellowfin catch is taken in schools associated with dolphins, and accordingly this method has the greatest impact on the yellowfin tuna population (Figure B-4), although it has almost the least impact per unit of weight captured of all fishing methods. It appears that the yellowfin population has experienced two different productivity regimes ( and ), with greater recruitment during the second regime. The two recruitment regimes (Figure B-3) correspond to two regimes in biomass (Figure B-4), the high-recruitment regime corresponding to greater biomasses. The spawning biomass ratio (the ratio of the current spawning biomass to that for the unfished stock; SBR) of yellowfin in the EPO was below the level corresponding to the average maximum sustainable yields (AMSYs) during the low-recruitment regime, but close to that level during the high-recruitment regime (Figure B-5). The two different productivity regimes may support two different levels of AMSY and associated SBRs, and the AMSY reported here is an average for the period. The current SBR is below the SBR level corresponding to the AMSY (Figure B-5). However, there is substantial uncertainty in the most recent estimate of SBR, and there is a moderate probability that the current SBR is above the level corresponding to the AMSY. The effort levels are estimated to be greater than those corresponding to the AMSY (based on the recent ( ) distribution of effort among the different fisheries). Because of the flat yield curve, however, the recent effort levels are estimated to be capable of producing, under average conditions, catch that is only slightly less than the AMSY. Future projections under the current effort levels and average recruitment indicate that the population is likely to remain at approximately the same level over the next 5 years (Figure B-6). These simulations were carried out using the average recruitment for the period. If they had been carried out using the average recruitment for the period, the projected trend in SBR and catches would have been more positive. Both the purse-seine and longline catches are expected to remain close to 2004 levels (Figure B-6). The AMSY has been stable during the assessment period (Figure B-7), which suggests that the overall pattern of selectivity has not varied a great deal through time. However, the overall level of fishing effort has varied with respect to the AMSY multiplier. The analysis indicates that strong cohorts entered the fishery during , and that these cohorts increased the biomass during However, these cohorts have now moved through the population, so the biomass decreased during The overall average weights of yellowfin tuna that are caught have consistently been much less than those that would maximize the AMSY, indicating that, from the yield-per-recruit standpoint, the yellowfin in the EPO are not harvested at the optimal size. There is substantial variability in the average weights of the yellowfin taken by the different fisheries, however. In general, the floating-object,
65 63 unassociated, and pole-and-line fisheries capture younger, smaller fish than do the dolphin-associated and longline fisheries. The longline fisheries and the purse-seine sets in the southern area on yellowfin associated with dolphins capture older, larger yellowfin than do the coastal and northern dolphin-associated fisheries. The AMSY calculations indicate that the yield levels could be increased if the fishing effort were diverted to the fisheries that catch larger yellowfin, and would be diminished if the fishing effort were diverted to catching smaller fish. Any such changes would also affect the SBR levels in a similar way. The conservation measures imposed in 2004 under IATTC Resolution C are predicted to result in slightly greater biomasses and SBRs than would otherwise have been the case. However, it is likely that the stock is below the AMSY level. A sensitivity analysis was carried out to estimate the effect of a stock-recruitment relationship. The results suggest that the model with a stock-recruitment relationship fits the data slightly better than the base case, but this result could also be explained by the regime shift, since the spawning biomass is low during the period of low recruitment and high during that of high recruitment. The results from the analysis with a stock-recruitment relationship, suggesti that the effort level is greater than that corresponding to the AMSY (Table B-1); however, the yield at this effort level is still only 6% less than the AMSY. The biomass is estimated to have been less than the biomass that would produce the AMSY for most of the modeling period, except for most of the period. The assessment results are similar to those from the previous assessments. The major differences occur, as expected, in the most recent years. The current assessment, and those for 2002, 2003, and 2004, indicate that the biomass increased in 2000, whereas the earlier assessments indicated a decline. In addition, SBR and the SBR corresponding to the AMSY have increased compared to the 2004 assessment because of changes in estimates of growth and recent age-specific fishing mortality. Summary 1. The results are similar to those of the previous five assessments, except that SBR at AMSY is greater than in these assessments. 2. The biomass is estimated to have declined very slightly in There is uncertainty about recent and future recruitment and biomass levels. 4. The estimate of the current SBR is less than that corresponding to the AMSY, but its confidence intervals encompass the AMSY. 5. The recent fishing mortality rates are 20% above those corresponding to the AMSY. 6. Increasing the average weight of the yellowfin caught could substantially increase the AMSY. 7. There have been two different productivity regimes, and the levels of AMSY and the biomass corresponding to the AMSY may differ between the regimes. 8. The results are more pessimistic if a stock-recruitment relationship is assumed.
 for the purse-seine fisheries, and retained catches for the pole-andline fishery and longline fisheries, of yellowfin tuna in the eastern Pacific Ocean,")
66 64 FIGURE B-1. Total catches (retained catches plus discards) for the purse-seine fisheries, and retained catches for the pole-andline fishery and longline fisheries, of yellowfin tuna in the eastern Pacific Ocean, , used in the stock assessment. The purse-seine catches for are based on unloading data. The data for the longline catches for are those reported to the IATTC by governments, and those for 2004 are predicted by the model based on 2003 effort levels and estimates of the biomass vulnerable to longlining in FIGURA B-1. Capturas totales (capturas retenidas más descartes) de las pesquerías de cerco, y capturas retenidas de las pesquerías cañera y palangreras, de atún aleta amarilla en el Océano Pacífico oriental, , usadas en la evaluación de la población. Las capturas cerqueras de se basan en datos de descargas. Los datos de las capturas palangreras de son las que reportaron los gobiernos a la CIAT, y las de 2004 son predichas por el modelo con base en el nivel de esfuerzo de 2003 y estimaciones de la biomasa vulnerable a los palangres en FIGURE B-2. Time series of average total annual fishing mortality of yellowfin tuna that have been recruited to the fisheries of the EPO. Each panel illustrates an average of four annual fishing mortality vectors that affected the fish of the age range indicated in the title of each panel. For example, the trend illustrated in the upper-left panel is an average of the fishing mortalities that affected fish that were 2-5 quarters old. FIGURA B-2. Series de tiempo de la mortalidad por pesca trimestral total media de atún aleta amarilla reclutado a las pesquerías del OPO. Cada recuadro ilustra un promedio de cuatro vectores trimestrales de mortalidad por pesca que afectaron los peces de la edad indicada en el título de cada recuadro. Por ejemplo, la tendencia ilustrada en el recuadro superior izquierdo es un promedio de las mortalidades por pesca que afectaron a los peces de entre 2 y 5 trimestres de edad.


67 65 FIGURE B-3. Estimated recruitment of yellowfin tuna to the fisheries of the EPO. The estimates are scaled so that the average recruitment is equal to 1.0. The bold line illustrates the maximum likelihood estimates of recruitment, and the shaded area indicates the approximate 95% confidence intervals around those estimates. FIGURA B-3. Reclutamiento estimado de atún aleta amarilla a las pesquerías del OPO. Se escalan las estimaciones para que el reclutamiento medio equivalga a 1,0. La línea gruesa ilustra las estimaciones de probabilidad máxima del reclutamiento, y el área sombreada indica los intervalos de confianza de 95% aproximados de esas estimaciones. FIGURE B-4. Biomass trajectory of a simulated population of yellowfin tuna that was not exploited during (dashed line) and that predicted by the stock assessment model (solid line). The shaded areas between the two lines represent the portion of the fishery impact attributed to each fishing method. FIGURA B-4. Trayectoria de la biomasa de una población simulada de atún aleta amarilla no explotada durante (línea de trazos) y la que predice el modelo de evaluación (línea sólida). Las áreas sombreadas entre las dos líneas represantan la porción del impacto de la pesca atribuida a cada método de pesca.
68 66 FIGURE B-5. Spawning biomass ratios (SBRs) for and SBRs projected during for yellowfin tuna in the EPO by the likelihood profile approximation method. The dashed horizontal line (at 0.44) identifies SBR AMSY. The shaded area represents the 95% confidence limits of the estimates. The estimates after 2005 (the large dot) indicate the SBR predicted to occur if effort continues at the average of that observed in 2004, catchability (with effort deviates) continues at the average for 2002 and 2003, and average environmental conditions occur during the next 10 years. FIGURA B-5. Cocientes de biomasa reproductora (SBR) para y SBR proyectados durante para el atún aleta amarilla en el OPO por el método de aproximación de perfil de verosimilitud. La línea de trazos horizontal (en 0.44) identifica SBR RPMS. El área sombreada representa los límites de confianza de 95% de las estimaciones. Las estimaciones a partir de 2005 (el punto grande) señalan el SBR predicho si el esfuerzo continúa en el nivel promedio de 2004, la capturabilidad (con desvíos de esfuerzo) continúa en el promedio de 2002 y 2003, y ocurren condiciones ambientales medias en los 10 próximos años. FIGURE B-6. Catches of yellowfin tuna during and simulated catches of yellowfin tuna during taken by the purse-seine and pole-and-line fleets (upper panel) and the longline fleet (lower panel), using the likelihood profile method. The shaded area represents the 95% confidence limits of the estimates. FIGURA B-6. Capturas de atún aleta amarilla durante y capturas simuladas de aleta amarilla durante por las flotas de cerco y de caña (recuadro superior) y la flota palangrera (recuadro inferior), usando el método de aproximación de perfil de verosimilitud. El área sombreada representa los intervalos de confianza de 95% estimades de las estimaciones.
69 67 FIGURE B-7. AMSY (upper panel), , and the change (increase or reduction) in the effort corresponding to the AMSY (lower panel), estimated separately for each year, using the average age-specific fishing mortality for that year. FIGURA B-7. RMSP (recuadro superior), , y cambio (aumento o reducción) del esfuerzo correspondiente al RMSP (recuadro inferior), estimado por separado para cada año, usando la mortalidad por pesca promedio por edad de ese año. TABLE B-1. Estimates of the AMSY and its associated quantities for the base case assessment and the sensitivity analysis including a stock-recruitment relationship with a steepness (h) of All the analyses are based on average fishing mortality for 2002 and B 2005, B AMSY, and B 0 are the biomass of yellowfin 1.5+ years old at the start of 2005, at AMSY, and without fishing, respectively, and S 2005, S AMSY, and S 0 are the female spawning biomass at the start of 2005, at AMSY, and without fishing, respectively. C 2004 is the estimated total catch in TABLA B-1. Estimaciones del RMSP y sus valores asociados para la evaluación del caso base y el análisis de sensibilidad que incluye una relación población-reclutamiento con una inclinación (h) de Todos los análisis se basan en la mortalidad por pesca media de 2002 y B 2005, B RMSP, y B 0 son la biomasa de aleta amarilla de edad 1.5+ años al principio de 2005, en RMSP, y sin pesca, respectivamente, y S 2005, S RMSP, y S 0 son la biomasa reproductora de hembras al principio de 2005, en RMSP, y sin pesca, respectivamente. C 2004 es la captura total estimada en Base case Caso base h = 0.75 AMSY RMSP (t) 284, ,775 B AMSY B RMSP (t) 419, ,276 S AMSY S RMSP (t) 8,144 10,141 B AMSY /B 0 B RMSP /B S AMSY /S 0 S RMSP /S C 2004 /AMSY C 2004 /RMSP B 2005 /B AMSY B 2005 /B RMSP S 2005 /S AMSY S 2005 /S RMSP F multiplier Multiplicador de F
70 68 B. ATÚN ALETA AMARILLA Se usó un análisis de la captura por talla y edad, A-SCALA (del inglés age-structured, catch-at-length analysis) para evaluar el atún aleta amarilla en el Océano Pacífico oriental (OPO). Se describe el método analítico en el Boletín de la CIAT, Vol. 22, No. 5, y se refiere a los lectores a los detalles técnicos en dicho informe. Para mayor detalle de la evaluación más reciente, ver el Informe de Evaluación de Stocks 6, disponible en la página web de la CIAT. La evaluación presentada en este informe se basa en el supuesto que existe una sola población de atún aleta amarilla en el OPO. El aleta amarilla se encuentra distribuido por todo el Océano Pacífico, pero la mayor parte de la captura proviene de las zonas oriental y occidental del mismo. Las capturas cerqueras de aleta amarilla son menores cerca del límite occidental del OPO (Figura A-1). Los desplazamientos de aletas amarillas marcados suelen ser de centenares, no miles, de kilómetros, y el intercambio entre el OPO y el Pacífico occidental parece ser limitado. Esto es consistente con las tendencias de la CPUE palangrera, que varían entre áreas. Es probable que exista una población continua en el Océano Pacífico entero, con intercambio de individuos a nivel local, aunque existe cierta evidencia genética de aislamiento local. No fue posible estimar las tasas de desplazamiento entre el OPO y el Pacífico occidental con los datos de marcado actualmente disponibles. La evaluación de poblaciones requiere cantidades sustanciales de información, incluyendo datos de capturas retenidas, descartes, esfuerzo de pesca, y composición por tamaño de las capturas de las distintas pesquerías. Se hicieron supuestos sobre procesos tales como crecimiento, reclutamiento, desplazamiento, mortalidad natural, mortalidad por pesca, y estructura de poblaciones. La evaluación para 2005 es diferente de la de 2004 en los aspectos siguientes. Se actualizaron los datos de captura y frecuencia de talla de las pesquerías de cerco y de caña para incluir datos nuevos de 2004 y datos revisados de Se actualizaron los datos de esfuerzo de estas pesquerías para incluir datos nuevos de 2004 y datos revisados de Se actualizaron los datos de captura de las pesquerías palangreras japonesas de , y se añadieron datos nuevos de Se actualizaron los datos de captura de las pesquerías palangreras de Taipei Chino para incluir datos nuevos de Se actualizaron los datos de captura de las pesquerías palangreras de China para incluir datos nuevos de 2003 y datos revisados de 2001 y Se actualizaron los datos de captura palangrera por talla de , y se añadieron datos nuevos de Se estandarizaron los datos de esfuerzo palangrero con un modelo lineal generalizado de la CPUE, usando datos de , en vez de la red neuronal usada previamente. Se ajustó la verosimilitud del modelo de crecimiento para tomar en cuenta el muestreo a talla en lugar de suponer un muestreo aleatorio. En la Figura B-1 se presentan los datos de captura. Se han observado niveles significativos de mortalidad por pesca en la pesquería de aleta amarilla en el OPO (Figura B-2). Fueron máximos para peces de edad mediana. Tanto el reclutamiento (Figura B-3) como la explotación han ejercido impactos sustanciales sobre la trayectoria de la biomasa de la especie (Figura B-4). La mayoría de la captura de aleta amarilla proviene de lances sobre cardúmenes asociados con delfines, y por lo tanto este método ha ejercido el mayor impacto sobre la población de aleta amarilla (Figura B-4), aunque su impacto por unidad de peso capturado es casi el más bajo de todos los métodos de pesca. Parece que la población de aleta amarilla ha experimentado dos regímenes de productividad distintos ( y ) con reclutamiento mayor en el segundo. Estos dos regímenes (Figura B-3) corresponden a dos regímenes en biomasa (Figura B-4), el régimen con reclutamiento mayor corresponde a biomasas mayores. El cociente de biomasa reproductora (el cociente de la biomasa reproductora actual a la de la población no explotada, denominado SBR (spawning biomass ratio)) de aleta amarilla en el OPO estuvo por debajo del nivel correspondiente a los rendimientos máximos sostenibles promedio (RMSP) durante el régimen de reclutamiento bajo, pero cerca de dicho nivel durante el régimen de reclutamiento alto (Figura B-5). Es posible que los dos regímenes de productividad soporten dos niveles distintos de RMSP y de SBR asociados, y el RMSP aquí reportado es el promedio del período de El SBR actual es inferior al nivel de SBR correspondiente al RMSP (Figura B-5). Sin embargo, hay una incertidumbre sustancial en la estimación más reciente de SBR, y existe una probabilidad moderada de que el SBR actual esté por encima del nivel correspondiente al RMSP. Se estima que los niveles de esfuerzo están por encima de aquéllos correspondientes al RMSP (a partir de la distribución reciente ( ) del esfuerzo entre las varias pesquerías). No obstante, debido a la curva de rendimiento plana, se estima que los niveles recientes de esfuerzo son capaces de producir, bajo condiciones medias, una captura sólo ligeramente inferior al RMSP. Proyecciones a futuro con los niveles actuales de esfuerzo y reclutamiento medio señalan que la población permanecerá probablemente en aproximadamente el mismo nivel durante los próximos cinco años (Figura B-6). Se realizaron estas simulaciones usando el reclutamiento medio del período de Si se usara el reclutamiento medio del período de , la tendencia proyectada del SBR y las capturas serían más positivas. Se espera que las capturas, tanto cerqueras como palangreras, continúen cerca de los niveles de 2004 (Figura B-6). El RMSP ha sido estable durante el período de la evaluación (Figura B-7), lo cual sugiere que el patrón general de selectividad no ha variado mucho con el tiempo. En cambio, el nivel general de esfuerzo de pesca ha variado con respecto al multiplicador de RMSP. El análisis indica que cohortes fuertes ingresaron a la pesquería durante y que incrementaron la biomasa durante , pero ya pasaron por la población, y la biomasa disminuyó durante
71 El peso medio de los aletas amarillas en la captura ha sido siempre muy inferior a aquél que incrementaría el RMSP al máximo, indicando que, desde el punto de vista de rendimiento por recluta, el aleta amarilla en el OPO no es pescado al tamaño óptimo. Hay una variabilidad sustancial en el peso promedio del aleta amarilla capturado por las distintas pesquerías. En general, las pesquerías sobre objetos flotantes, no asociadas, y cañera capturan peces más jóvenes y pequeños que las pesquerías asociadas con delfines y palangreras. En las pesquerías palangreras y en los lances sobre delfines en la zona Sur se capturan aletas amarillas de mayor edad y tamaño que en las pesquerías sobre delfines Costera y Norte. Los cálculos de RMSP indican que se podrían incrementar los niveles de rendimiento si se desviara el esfuerzo de pesca hacia las pesquerías que capturan aleta amarilla de mayor tamaño, y que disminuirían si el esfuerzo de pesca fuera dirigido hacia la captura de peces pequeños Cualquier cambio de este tipo afectaría también los niveles de SBR de forma similar. Se predice que las medidas de conservación impuestas en 2004 de conformidad con la Resolución C de la CIAT resultarán en una biomasa y un SBR ligeramente mayores de lo que hubiesen sido sin las medidas. No obstante, es probable que la población esté por debajo del nivel de RMSP. Se realizó un análisis de sensibilidad para estimar el efecto de una relación población-reclutamiento. Los resultados sugieren que el modelo con una relación población-reclutamiento se ajusta a los datos ligeramente mejor que el caso base, pero este resultado podría también ser explicado por el cambio de régimen, ya que la biomasa reproductora es baja durante el período de reclutamiento bajo y alto durante el reclutamiento alto. Los resultados del análisis con una relación población-reclutamiento sugieren que el nivel de esfuerzo está por encima del nivel correspondiente al RMSP (Tabla B-1); sin embargo, el rendimiento en este nivel de esfuerzo es todavía tan sólo 6% inferior al RMSP. Se estima que la biomasa fue inferior a la biomasa que produciría el RMSP durante la mayor parte del período del modelo, con la excepción de la mayor parte del período de Los resultados de la evaluación son similares a aquéllos de las evaluaciones previas. Las diferencias más grandes ocurren, tal como se esperaría, en los años más recientes. La evaluación actual, al igual que las de 2002, 2003 y 2004, indica que la biomasa aumentó en 2000, mientras que las previas indicaron una disminución. Además, el SBR y el SBR correspondiente al RMSP han aumentado con respecto a la evaluación de 2004 debido a cambios en las estimaciones de crecimiento y la reciente mortalidad por pesca por edad. Resumen 1. Los resultados son similares a los de las cinco evaluaciones previas, excepto que el SBR en RMSP es mayor que en dichas evaluaciones. 2. Se estima que la biomasa disminuyó muy ligeramente en Existe incertidumbre acerca de los niveles recientes y futuros de reclutamiento y biomasa. 4. El SBR actual es inferior a aquél correspondiente al RMSP, pero sus intervalos de confianza abarcan el RMSP. 5. Las tasas recientes de mortalidad por pesca son 20% mayores que aquéllas correspondientes al RMSP. 6. Un aumento del peso medio del aleta amarilla capturado podría incrementar el RMSP sustancialmente. 7. Hubo dos regímenes distintos de productividad, y los niveles de RMSP y la biomasa correspondiente al RMSP podrían ser diferentes para los dos regímenes. 8. Los resultados son más pesimistas si se supone una relación población-reclutamiento. 69

72 70 C. SKIPJACK TUNA An age-structured catch-at-length analysis (A-SCALA) is used to assess skipjack tuna in the eastern Pacific Ocean (EPO). The analysis method is described in IATTC Bulletin, Vol. 22, No. 5, and readers are referred to that report for technical details. This method was used for the most recent assessment of skipjack tuna, conducted in 2004 (IATTC Stock Assessment Report 5; available on the IATTC web site), which included data up to and including The stock assessment requires substantial amounts of information, including data on retained catch, discards, fishing effort, and the size compositions of the catches of the various fisheries. The catches used in the assessment are presented in Figure C-1. Several assumptions regarding processes such as growth, recruitment, movement, natural mortality, fishing mortality, and stock structure have also been made. The assessment is still considered preliminary because (1) it is not known whether the catch per day of fishing for the purse-seine fisheries is proportional to the abundance of skipjack, (2) it is possible that there is a population of large skipjack that is invulnerable to the fisheries, and (3) the stock structure in relation to fish in the EPO and in the western and central Pacific Ocean is uncertain. However, the results from sensitivity analyses for this assessment are more consistent than those of previous years. The recruitment of skipjack tuna to the fisheries of the EPO is highly variable (Figure C-2). The fishing mortality (Figure C-3) is estimated to be about the same or less than the rate of natural mortality. These estimates of fishing mortality are supported by estimates from tagging data. The biomass fluctuates in response to variations in both recruitment and exploitation (Figure C-4). The estimates of absolute biomass are moderately sensitive to weights given to the information about abundance in the catch and effort data for the floating-object fisheries and the monotonic selectivity assumption, but the trends in biomass are not. The analysis indicates that a group of relatively strong cohorts (but not as strong as those of 1998) entered the fishery in , and that these cohorts increased the biomass and catches during There is an indication that the most recent recruitments are average, which may lead to lower biomasses and catches. However, these estimates of low recruitment are based on limited information, and are therefore uncertain. There is considerable variation in spawning biomass ratio (ratio of the spawning biomass to that for the unfished stock; SBR) for skipjack tuna in the EPO (Figure C-5). In 2003 the SBR was at a high level (about 0.61). Estimates based on average maximum sustainable yield (AMSY) and yield-per-recruit indicate that maximum yields are achieved with infinite fishing mortality because the critical weight is less than the average weight at recruitment to the fishery. However, this is uncertain because of uncertainties in the estimates of natural mortality and growth. The estimates of SBR are not sensitive to weights given to the information about abundance in the catch and effort data for the floating-object fisheries and the monotonic selectivity assumption. FIGURE C-1. Total catches (retained catches plus discards) for the purse-seine fisheries on floating objects and unassociated schools, and for other fisheries combined, of skipjack tuna in the eastern Pacific Ocean, , used in the stock assessment. The purse-seine catches are based on unloading data. FIGURA C-1. Capturas totales (capturas retenidas más descartes) de las pesquerías de cerco sobre objetos flotantes y cardúmenes no asociados, y de las demás pesquerías combinadas, de atún barrilete en el Océano Pacífico oriental, , usadas en la evaluación de la población. Las capturas cerqueras se basan en datos de descargas.

73 71 FIGURE C-2. Estimated recruitment of skipjack tuna to the fisheries of the EPO. The estimates are scaled so that the average recruitment is equal to 1.0. The solid line illustrates the maximum-likelihood estimates of recruitment, and the shaded area the 95% confidence intervals. The labels on the time axis are drawn at the start of each year, but, since the assessment model represents time on a monthly basis, there are 12 estimates of recruitment for each year. FIGURA C-2. Reclutamiento estimado de atún barrilete a las pesquerías del OPO. Se escalan las estimaciones para que el reclutamiento medio equivalga a 1,0. La línea sólida ilustra las estimaciones de reclutamiento de probabilidad máxima, y el área sombreada los intervalos de confianza de 95%. Se dibujan las leyendas en el eje de tiempo al principio de cada año, pero, ya que el modelo de evaluación representa el tiempo por meses, hay 12 estimaciones de reclutamiento para cada año. FIGURE C-3. Time series of average total monthly fishing mortality of skipjack tuna recruited to the fisheries of the EPO. Each panel illustrates an average of 12 monthly fishing mortality vectors that affected fish of the age range indicated in the title of each panel. For example, the trend illustrated in the left panel is an average of the fishing mortalities that affected fish that were 9-20 months old. FIGURA C-3. Series de tiempo de la mortalidad por pesca mensual total media de atún barrilete reclutado a las pesquerías del OPO. Cada recuadro ilustra un promedio de 12 vectores mensuales de mortalidad por pesca que afectaron los peces de la edad indicada en el título de cada recuadro. Por ejemplo, la tendencia ilustrada en el recuadro izquierdo es un promedio de las mortalidades por pesca que afectaron a los peces de entre 9 y 20 meses de edad.

74 72 FIGURE C-4. Biomass trajectory of a simulated population of skipjack tuna that was not exploited during (dashed line) and that predicted by the stock assessment model (solid line). The shaded areas between the two lines represent the portion of the fishery impact attributed to each fishing method. FIGURA C-4. Trayectoria de la biomasa de una población simulada de atún barrilete no explotada durante (línea de trazos) y la que predice el modelo de evaluación (línea sólida). Las áreas sombreadas entre las dos líneas represantan la porción del impacto de la pesca atribuida a cada método de pesca. FIGURE C-5. Estimated time series of spawning biomass ratios (SBRs) for skipjack tuna in the EPO, from the monotonic selectivity assessment. The shaded area represents the 95% confidence limits of the estimates. FIGURA C-5. Series de tiempo estimadas de los cocientes de biomasa reproductora (SBR) de atún barrilete en el OPO, de la evaluación de selectividad monotónica. El área sombreada representa los intervales de confianza de 95% de las estimaciones.
75 C. ATÚN BARRILETE Se usa un análisis de la captura por talla y edad, A-SCALA (del inglés age-structured, catch-at-length analysis) para evaluar el atún barrilete en el Océano Pacífico oriental (OPO). Se describe el método analítico en el Boletín de la CIAT, Vol. 22, No. 5, y se refiere a los lectores a los detalles técnicos en dicho informe. Se usó este método para la evaluación más reciente del barrilete, realizada en 2004 (Informe de Evaluación de Stocks 5, disponible en la página web de la CIAT), la que incluyó datos de La evaluación de poblaciones requiere cantidades sustanciales de información, incluyendo datos de capturas retenidas, descartes, esfuerzo de pesca, y composición por tamaño de las capturas de las distintas pesquerías. En la Figura C-1 se ilustran las capturas usadas en la evaluación. Se hicieron también varios supuestos sobre procesos tales como crecimiento, reclutamiento, desplazamiento, mortalidad natural, mortalidad por pesca, y estructura de poblaciones. La evaluación es considerada preliminar porque (1) no se sabe si la captura por día de pesca de las pesquerías de cerco es proporcional a la abundancia del barrilete, (2) es posible que exista una población de barrilete grande que es invulnerable a las pesquerías, y (3) la estructura de la población con respecto a los peces en el OPO y en el Océano Pacífico occidental y central es incierta. Sin embargo, los resultados de los análisis de sensibilidad para la presente evaluación son más consistentes con aquéllos de años anteriores. El reclutamiento del atún barrilete a las pesquerías en el OPO es altamente variable (Figura C-2). Se estima que la mortalidad por pesca (Figura C-3) es aproximadamente igual, o mayor, que la tasa de mortalidad natural. Estas estimaciones de la mortalidad por pesca son respaldadas por estimaciones de datos de marcado. La biomasa fluctúa en reacción a variaciones en el reclutamiento la explotación (Figura C-4). Las estimaciones de biomasa absoluta son moderadamente sensibles a la ponderación asignada a la información sobre abundancia en los datos de captura y esfuerzo de las pesquerías sobre objetos flotantes y el supuesto de selectividad monotónica, pero las tendencias en la biomasa no lo son. El análisis indica que un grupo de cohortes relativamente fuertes (pero no tan fuertes como las de 1998) ingresó a la pesquería en , y esas cohortes incrementaron la biomasa y las capturas durante Existe una indicación de que los reclutamientos más recientes fueron medios, lo cual podría llevar a biomasas y capturas más bajas, pero estas estimaciones de reclutamiento bajo se basan en información limitada, y son por lo tanto inciertas. Hay una variación considerable en el cociente de la biomasa reproductora a la biomasa reproductora de la población no explotada (spawning biomass ratio, SBR) del atún barrilete en el OPO (Figura C-5). En 2003 el SBR estuvo en un nivel alto (aproximadamente 0.61). Las estimaciones basadas en el rendimiento máximo sostenible promedio (RMSP) y el rendimiento por recluta señalan que se logra el rendimiento máximo con una mortalidad por pesca infinita porque el peso crítico es menor que el peso medio de reclutamiento a la pesquería. Sin embargo, esto no es seguro debido a incertidumbres en las estimaciones de mortalidad natural y crecimiento. Las estimaciones de SBR no son sensibles a la ponderación asignada a la información sobre abundancia en los datos de captura y esfuerzo de las pesquerías sobre objetos flotantes y el supuesto de selectividad monotónica. 73
76 74 D. BIGEYE TUNA There have been substantial changes in the bigeye tuna fishery in recent years (Figure D-1). Initially, the majority of the bigeye catch was taken by longline vessels. With the expansion of the fishery on fish-aggregating devices (FADs) since 1993, the purse-seine fishery has taken an increasing proportion of the bigeye catch. The FAD fishery captures smaller bigeye, and has therefore reduced the yield per recruit and the average maximum sustainable yield (AMSY). An age-structured catch-at-length analysis, A-SCALA, was used to assess bigeye tuna in the eastern Pacific Ocean (EPO). The analysis method is described in IATTC Bulletin, Vol. 22, No. 5, and readers are referred to that report for technical details. For further information on the most recent assessment, see IATTC Stock Assessment Report 6, available on the IATTC web site. Bigeye are distributed across the Pacific Ocean, but the bulk of the catch is made in the eastern and western parts of that ocean. The purseseine catches of bigeye tuna are substantially less in the vicinity of the western boundary of the EPO (Figure A-3); the longline catches are more continuous, but show lower levels between 160ºW and 180º (Figure A-4). Bigeye tuna do not show large movements in recent studies, 95% of tagged bigeye recaptured were caught less than 1000 miles from the locations at which they were released and current information, albeit less than adequate, indicates little exchange between the eastern and western Pacific Ocean (Figure D-2). This is consistent with the fact that longline catch-per-unit-of-effort (CPUE) trends differ among areas. It is likely that there is a continuous stock throughout the Pacific Ocean, with exchange of individuals at a local level. The assessment reported here is conducted as if there were a single stock in the EPO. Its results are consistent with results of other analyses of bigeye tuna on a Pacific-wide basis. In addition, analyses have shown that the results are insensitive to the spatial structure of the analysis. Several inputs into this assessment differ from that for New results from recent age and growth studies have been incorporated. The catch and length-frequency data for the purse-seine and pole-and-line fisheries have been updated to include new data for 2004 and revised data for The effort data for the purse-seine and pole-and-line fisheries have been updated to include new data for 2004 and revised data for Monthly reporting of catch data for the longline fishery provided, at the time of the assessment, provisional 2004 catch data for Japan and the Republic of Korea and partial catch data for the other nations. The catch data for the Japanese longline fisheries have been updated for , and new data for 2003 have been added. The catch data for the longline fisheries of Chinese Taipei have been updated to include new data for The catch data for the longline fisheries of China have been updated to include new data for 2003 and revised data for 2001 and The longline catch-at-length data for have been updated and new data for 2003 have been added. The longline effort data based on statistical habitat-based standardization of the CPUE have been updated to include data for 2002, and raw catch and effort data were used to extend the time series to the second quarter of A sensitivity analysis was performed that investigated the effects of including a stock-recruitment relationship in the assessment. There have been important changes in the amounts of fishing mortality caused by the fisheries that catch bigeye tuna in the EPO. On average, the fishing mortality of bigeye less than about four and a half years old has increased substantially since 1993, and that of older fish has increased slightly (Figure D-3). The increase in the average fishing mortality on the younger fish was caused by the expansion of the fisheries that catch bigeye in association with floating objects. There are several important features in the estimated time series of bigeye recruitment (Figure D-4). First, the estimates of the recruitment before 1993 are uncertain, as the floating-object fisheries, which catch small bigeye, were not operating. Second, there was a period of above-average recruitment during , followed by a period of below-average recruitment during The recruitments were above average in 2001 and Third, the estimate of the most recent recruitment is uncertain, because recently-recruited bigeye are represented in only a few length-frequency samples. The extended period of relatively high recruitments during coincided with the expansion of the fisheries that catch bigeye in association with floating objects. Fishing has reduced the total biomass of bigeye present in the EPO, and it is predicted that it will be near its lowest level by the end of 2005 (Figure D-5). There has been an accelerated decline in biomass since the peak in Analysis of the levels of fishing mortality associated with each fishery indicates that, since the expansion of the purse-seine fishing on floating objects during the early to mid-1990s, the purse-seine fishery has had a much greater impact on the stock than has the longline fishery. The relationship between recruitment and the environmental index used in previous assessments was found to be not significant, and therefore was not used in the analysis. At the beginning of 2005, the spawning biomass of bigeye tuna in the EPO (Figure D-6; large dot) had declinied from a recent high level. At that time the spawning biomass ratio (the ratio of current spawning biomass to biomass of spawners in the absence of fishing mortality; SBR) was estimated to be about 0.13, about 41% less than the level corresponding to the average maximum sustainable yield (SBR AMSY ), with lower and upper confidence limits (±2 standard deviations) of about 0.08 and The estimate of the upper confidence bound is less than the estimate of SBR AMSY (0.21). Previous assessments had predicted that the spawning biomass would decline to below the SBR AMSY
77 level. Estimates of the average SBR projected to occur during indicate that the SBR is likely to remain below the level corresponding to the AMSY for many years unless fishing mortality is greatly reduced or recruitment is greater than average levels for a number of years (Figure D-7). The average weight of fish in the catch of all fisheries combined declined substantially in 1993 and 1994, and has remained at that lower level since then. The recent age-specific pattern of fishing mortality is not satisfactory from a yield-per-recruit perspective. In the base case assessment, recent catches are estimated to have been about 5% greater than the AMSY (Table D-1). If the fishing mortality is proportional to the fishing effort, and the current patterns of age-specific selectivity are maintained, the level of fishing effort corresponding to the AMSY is about 57% of the recent ( ) level of effort. Decreasing the effort to 57% of its present level would increase the long-term average yield by about 11% and would increase the spawning potential of the stock by about 69%. The AMSY of bigeye in the EPO could be maximized if the age-specific selectivity pattern were similar to that for the longline fishery that operates south of 15 N because it catches larger individuals. Before the expansion of the floating-object fishery that started in 1993, the AMSY was greater than the current AMSY and the fishing mortality was less than that corresponding to the AMSY (Figure D-8). All analyses considered suggest that at the start of 2005 the spawning biomass was below the level corresponding to the AMSY (Table D- 1). The AMSY and the fishing mortality (F) multiplier are sensitive to how the assessment model is parameterized, the data that are included in the assessment, and the periods assumed to represent average fishing mortality, but under all scenarios considered, the current fishing mortality is well above the level corresponding to the AMSY. The estimates of recruitment and biomass were only moderately sensitive to the steepness of the stock-recruitment relationship. The current status and future projections are considerably more pessimistic, in terms of stock status, if a stock-recruitment relationship (h = 0.75) exists. The effects of IATTC Resolution C are estimated to be insufficient to allow the stock to rebuild. If the effort is reduced to levels corresponding to the AMSY, the stock will rebuild to SBR AMSY within the 5-year projection period. Summary: 1. Recent fishing mortality levels are 75% greater than those corresponding to the AMSY. 2. As a consequence, if fishing effort is not reduced, total biomass and spawning biomass will remain around the lowest levels observed during the period modelled ( ). 3. The current status and future projections are considerably more pessimistic in terms of stock status, if a stock-recruitment relationship (h = 0.75) exists. 4. These conclusions are robust to the alternative model and data formulations considered in this and previous analyses. 75
 for the purse-seine fisheries, and retained catches for the longline fisheries, of bigeye tuna in the eastern Pacific Ocean, 1975-2004, used in the")

78 76 FIGURE D-1. Total catches (retained catches plus discards) for the purse-seine fisheries, and retained catches for the longline fisheries, of bigeye tuna in the eastern Pacific Ocean, , used in the stock assessment. The purse-seine catch data for are based on unloading data, those for on unloading data adjusted to account for mis-indentification, and those for on species composition sampling. FIGURA D-1. Capturas totales (capturas retenidas más descartes) de las pesquerías de cerco y capturas retenidas de las pesquerías palangreras de atún patudo en el Océano Pacífico oriental, , usadas en la evaluación de la población. Los datos de las capturas cerqueras de se basan en datos de descargas, aquéllos de en datos de descargas adjustados para tomar en cuenta identificaciones incorrectas, y aquéllos de en el muestreo de composición por especies. FIGURE D-2. Movements of more than 1000 nm by tagged bigeye tuna in the Pacific Ocean. FIGURA D-2. Desplazamientos de más de 1000 mn de atunes patudo marcados en el Océano Pacífico.
79 77 FIGURE D-3. Time series of average total annual fishing mortality on bigeye tuna recruited to the fisheries of the EPO. Each panel illustrates an average of four annual fishing mortality vectors that affected the fish in the range of ages indicated in the title of each panel. For example, the trend illustrated in the upper left panel is an average of the fishing mortalities that affected fish that were 1-4 quarters old. FIGURA D-3. Series de tiempo de la mortalidad por pesca trimestral total media de atún patudo reclutado a las pesquerías del OPO. Cada recuadro ilustra un promedio de cuatro vectores trimestrales de mortalidad por pesca que afectaron los peces de la edad indicada en el título de cada recuadro. Por ejemplo, la tendencia ilustrada en el recuadro superior izquierdo es un promedio de las mortalidades por pesca que afectaron a peces de entre 1-4 trimestres de edad. FIGURE D-4. Estimated recruitment of bigeye tuna to the fisheries of the EPO. The estimates are scaled so that the estimate of virgin recruitment is equal to 1.0. The solid line shows the maximum likelihood estimates of recruitment, and the shaded area indicates the approximate 95% confidence intervals around those estimates. FIGURA D-4. Reclutamiento estimado de atún patudo a las pesquerías del OPO. Se escalan las estimaciones para que la estimación de reclutamiento virgen equivalga a 1,0. La línea sólida indica las estimaciones de reclutamiento de verosimilitud máxima, y el área sombreada indica los intervalos de confianza de 95% aproximados de esas estimaciones.
 and that predicted by the stock")
 y la que predice el modelo de")
80 78 FIGURE D-5. Biomass trajectory of a simulated population of bigeye tuna that was not exploited during (dashed line) and that predicted by the stock assessment model (solid line). The shaded areas between the two lines show the portions of the fishery impact attributed to each fishery. FIGURA D-5. Trayectoria de la biomasa de una población simulada de atún patudo no explotada durante (línea de trazos) y la que predice el modelo de evaluación (línea sólida). Las áreas sombreadas entre las dos líneas señalan la porción del impacto de la pesca atribuida a cada método de pesca.
81 FIGURE D-6. Estimated time series of spawning biomass ratios (SBRs) for bigeye tuna in the EPO. The dashed horizontal line (at about 0.21) identifies the SBR at AMSY. The solid line shows the maximum likelihood estimates, and the shaded areas are 95% confidence intervals around those estimates. The estimates after 2005 (the large dot) indicate the SBR predicted to occur if effort continues at the average of that observed in 2004, catchability (with effort deviates) continues at the average for 2002 and 2003 (except for the northern longline fishery, for which the data for are used), and average environmental conditions occur during the next 5 years. FIGURA D-6. Serie de tiempo estimada de los cocientes de biomasa reproductora (SBR) para el atún patudo en el OPO. La línea de trazos horizontal (en aproximadamente 0.21) identifica el SBR en RMSP. La línea sólida señala las estimaciones de verosimilitud máxima, y el área sombreada representa los intervalos de confianza de 95% alrededor de esas estimaciones. Las estimaciones a partir de 2005 (el punto grande) señalan el the SBR predicho si el esfuerzo continúa en el nivel observado en 2004, la capturabilidad (con desvíos de esfuerzo) continúa en el promedio de 2002 y 2003 (con excepción de la pesquería palangre del norte, para la cual se utiliza los datos de ), y con condiciones ambientales promedio en los 5 próximos años. 79
82 80 FIGURE D-7. Catches of bigeye for and predicted catches of bigeye for for the purse-seine and poleand-line (upper panel) and longline (lower panel) fisheries. The predicted catches are based on average effort for 2004 and average catchability for 2002 and 2003 (except for the northern longline fishery, for which the data for are used). The shaded areas represent 95% confidence intervals for the predictions of the future catches. Note that the vertical scales of the panels are different. FIGURA D-7. Capturas de atún patudo registradas durante y predichas para por las pesquerías de cerco y de caña (recuadro superior) y palangreras (recuadro inferior). Las capturas predichas se basan en el esfuerzo promedio de 2004 y la capturabilidad promedio de 2002 y 2003 (con excepción de la pesquería palangrera del sur, para la cual se utilizan los datos de ). Las zonas sombreadas representan los intervalos de confianza de 95% de las predicciones de capturas futuras. Nótese que las escalas verticales de los recuadros son diferentes. FIGURE D-8. AMSY (upper panel), , and the change (increase or reduction) in the effort required to produce the AMSY (lower panel), estimated separately for each year, using the average age-specific fishing mortality for that year. FIGURA D-8. RMSP (recuadro superior) y cambio (aumento o reducción) del esfuerzo necesario para producir el RMSP (recuadro inferior), estimado por separado para cada año, usando la mortalidad por pesca promedio por edad de ese año.
83 81 TABLE D-1. Estimates of the AMSY and its associated quantities for the base case assessment and the sensitivity analysis including a stock-recruitment relationship with a steepness (h) of All analyses are based on average fishing mortality for 2002 and B 2005, B AMSY, and B 0 are the biomass of bigeye 1+ years old at the start of 2005, at AMSY, and without fishing, respectively, and S 2005, S AMSY, and S 0 are the female spawning biomass at the start of 2005, at AMSY, and without fishing, respectively. C 2004 is the estimated total catch in TABLA D-1. Estimaciones del RMSP y sus valores asociados para la evaluación del caso base y el análisis de sensibilidad que incluye una relación población-reclutamiento con una inclinación (h) de Todos los análisis se basan en la mortalidad por pesca media de 2002 y B 2005, B RMSP, y B 0 son la biomasa de patudo de edad 1+ años al principio de 2005, en RMSP, y sin pesca, respectivamente, y S 2005, S RMSP, y S 0 son la biomasa reproductora de hembras al principio de 2005, en RMSP, y sin pesca, respectivamente. C 2004 es la captura total estimada en Base case Steepness = 0.75 Caso base Inclinación = 0.75 AMSY RMSP (t) B AMSY B RMSP (t) S AMSY S RMSP (t) B AMSY /B 0 B RMSP /B S AMSY /S 0 S RMSP /S C 2004 /AMSY C 2004 /RMSP B 2005 /B AMSY B 2005 /B RMSP S 2005 /S AMSY S 2005 /S RMSP F multiplier Multiplicador de F
84 82 D. ATÚN PATUDO Han ocurrido cambios sustanciales en la pesquería de atún patudo en los últimos años (Figura D-1). Al principio, la mayor parte de la captura de patudo fue lograda por buques palangreros. Con la expansión de la pesca sobre dispositivos agregadotes de peces (plantados) desde 1993, la pesquería de cerco ha tomado una proporción creciente de la captura de la especie. Esta pesquería captura patudo de menor tamaño, y por lo tanto ha reducido el rendimiento por recluta y el rendimiento máximo sostenible promedio (RMSP). Se usa un análisis de la captura por talla y edad, A-SCALA (del inglés age-structured, catch-at-length analysis) para evaluar el atún patudo en el Océano Pacífico oriental (OPO). Se describe el método analítico en el Boletín de la CIAT, Vol. 22, No. 5, y se refiere a los lectores a los detalles técnicos en dicho informe. Para mayor detalle de la evaluación más reciente, ver el Informe de Evaluación de Stocks 6, disponible en la página web de la CIAT. El patudo se encuentra distribuido por todo el Océano Pacífico, pero la mayor parte de la captura proviene de las zonas oriental y occidental del mismo. Las capturas cerqueras de patudo son sustancialmente menores alrededor del límite occidental del OPO (Figura A-3); las capturas palangreras son más continuas, pero muestran niveles más bajos entre 160ºO y 180º (Figura A-4). El patudo no se desplaza grandes distancias en estudios recientes, el 95% de los especimenes marcados recapturados fueron capturados a menos de 1000 millas de su punto de liberación y la información actual, aunque insuficiente, indica poco intercambio entre el Pacífico oriental y occidental (Figura D-2). Esto es consistente con las diferencias de las tendencias de la captura por unidad de esfuerzo (CPUE) palangrera entre zonas. Es probable que exista una población continua en el Océano Pacífico entero, con intercambio de individuos a nivel local. La evaluación aquí descrita fue realizada como si hubiese una sola población en el OPO. Los resultados son consistentes con los resultados de otros análisis del atún patudo en el Pacífico entero. Además, los análisis han demostrado que los resultados no son sensibles a la estructura espacial del análisis. Varios insumos de la presente evaluación son diferentes de aquéllos de Fueron incorporados nuevos resultados de estudios recientes de edad y crecimiento. Se actualizaron los datos de captura y frecuencia de talla de las pesquerías de cerco y de caña para incluir datos nuevos de 2004 y datos revisados de Los informes mensuales de datos de captura de la pesquería palangrera brindaron, en el momento de la evaluación, datos de captura provisionales de 2004 en el caso de Japón y la República de Corea y parciales en el caso de las otras naciones. Se actualizaron los datos de captura de las pesquerías palangreras japonesas de y se añadieron datos nuevos de Se actualizaron los datos de captura de las pesquerías palangreras de Taipei Chino para incluir datos nuevos de Se actualizaron los datos de captura de las pesquerías palangreras de China para incluir datos nuevos de 2003 y datos revisados de 2001 y Se actualizaron los datos de captura palangrera por talla de y se añadieron datos nuevos de Se actualizaron los datos de esfuerzo palangrero basados en una estandarización estadística basada en hábitat de la CPUE para incluir datos de 2002, y se usaron datos no procesados de captura y esfuerzo para extender la serie de tiempo hasta el segundo trimestre de Se realizó un análisis de sensibilidad que investigó los efectos de la inclusión de una relación población-reclutamiento en la evaluación. Han ocurrido cambios importantes en la cantidad de mortalidad por pesca causada por las pesquerías que capturan atún patudo en el OPO. En promedio, la mortalidad por pesca de patudo de menos de unos cuatro años y medio de edad ha aumentado sustancialmente desde 1993, y la de los peces mayores aumentó ligeramente (Figura D-3). El aumento en la mortalidad por pesca media de los peces más jóvenes fue causado por la expansión de las pesquerías que capturan patudo en asociación con objetos flotantes. La serie de tiempo de estimaciones del reclutamiento de patudo tiene varias características importantes (Figura D-4). En primer lugar, las estimaciones del reclutamiento antes de 1993 son inciertas, ya que las pesquerías sobre objetos flotantes, que capturan patudo pequeño, no estaban en operación. En segundo lugar, hubo un período de reclutamiento superior al promedio en , seguido por un período de reclutamiento inferior al promedio en Los reclutamientos fueron superiores al promedio en 2001 y En tercer lugar, la estimación del reclutamiento más reciente es incierta, debido a que el patudo reclutado recientemente se encuentra representado en solamente unos pocos muestras de frecuencia de talla. El período extendido de reclutamientos relativamente altos durante coincidió con la expansión de las pesquerías que capturan patudo en asociación con objetos flotantes. La pesca ha reducido la biomasa total de patudo presente en el OPO, y se predice que estará cerca de su nivel más bajo al fin de 2005 (Figura D-5). Ha ocurrido una disminución acelerada de la biomasa desde el pico en Un análisis de los niveles de mortalidad por pesca asociados con cada pesquería indica que, desde la expansión de la pesca con red de cerco sobre objetos flotantes a principios y mediados de la década de los 1990, la pesquería de cerco ha ejercido un impacto mucho mayor sobre la población que la pesquería palangrera. Se descubrió que la relación entre el reclutamiento y el índice ambiental usado en las evaluaciones previas no es significativa, y no fue por tanto usada en el análisis.
85 Al principio de 2005, la biomasa reproductora de atún patudo en el OPO (Figura D-6, punto grande) había disminuido de un nivel alto reciente. En ese momento se estimó el cociente de biomasa reproductora (el cociente de la biomasa reproductora actual a la de la población no explotada, denominado SBR (spawning biomass ratio)) en aproximadamente 0.13, un 41% menos que el nivel correspondiente al rendimiento máximo sostenible promedio (SBR RMSP ), con límites de confianza superior e inferior (±2 desviaciones estándar) de aproximadamente 0.08 y La estimación del límite de confianza superior es menor que la estimación de SBR RMSP (0.21). Las evaluaciones previas habían predicho que la biomasa reproductora disminuiría a un nivel inferior al SBR RMSP. Estimaciones del SBR medio que se proyecta ocurrirá durante indican que es probable que el SBR alcance un nivel bajo histórico en y permanezca por debajo del nivel correspondiente al RMSP durante muchos años a menos que se reduzca mucho la mortalidad por pesca o el reclutamiento sea mayor al promedio durante varios años (Figura D-7). El peso promedio del pescado en la captura de todas las pesquerías combinadas disminuyó sustancialmente en 1993 y 1994, y ha permanecido en ese nivel bajo desde entonces. El patrón reciente de mortalidad por pesca por edad no es satisfactorio del punto de vista de rendimiento por recluta. En la evaluación del caso base se estima que las capturas recientes fueron un 5% superiores al RMSP (Tabla D-1). Si la mortalidad por pesca es proporcional al esfuerzo de pesca, y se mantienen los patrones actuales de selectividad por edad, el nivel de esfuerzo de pesca correspondiente al RMSP es un 57% del nivel de esfuerzo reciente ( ). Reducir el esfuerzo al 57% de su nivel actual incrementaría el rendimiento medio a largo plazo un 11%, pero aumentaría el potencial de reproducción de la población un 69%. Se podría incrementar al máximo el RMSP de patudo en el OPO si el patrón de selectividad por edad fuese similar a aquél de la pesquería palangrera que faena al sur de 15 N porque captura peces mayores. Antes de la expansión de la pesquería sobre objetos flotantes que empezó en 1993, el RMSP fue mayor que el RMSP actual, y la mortalidad por pesca fue menor que la que corresponde al RMSP (Figura D-8). Todos los análisis considerados sugieren que, al principio de 2005, la biomasa reproductora estuvo por debajo del nivel correspondiente al RMSP (Tabla D-1). El RMSP y el multiplicador de mortalidad por pesca (F) son sensibles a la parametrización del modelo, a los datos que se incluyen en la evaluación, y a los períodos que se supone representan la mortalidad por pesca media, pero en todos los escenarios considerados, la mortalidad por pesca actual está muy por encima del nivel correspondiente al RMSP. Las estimaciones de reclutamiento y biomasa fueron tan sólo moderadamente sensibles a la inclinación de la relación poblaciónreclutamiento. La condición actual y las proyecciones a futuro son considerablemente más pesimistas, en términos de la condición de la población, si existe una relación población-reclutamiento (h = 0.75). Se estima que los efectos de la Resolución C de la CIAT serán insuficientes para permitir a la población recuperarse. Si se redujera el esfuerzo a los niveles correspondientes al RMSP, la población se recuperaría al nivel de SBR RMSP dentro de los cinco años abarcados por la proyección. Resumen: 1. Los niveles recientes de mortalidad por pesca son un 75% mayores que los que corresponden al RMSP. 2. Como consecuencia, si no se reduce el esfuerzo de pesca, la biomasa total y la biomasa reproductora permanecerán cerca de los niveles más bajos observados durante el período del modelo ( ). 3. La situación actual y las proyecciones a futuro son considerablemente más pesimistas, en términos de la condición de la población, si existe una relación población-reclutamiento (h = 0.75). 4. Estas conclusiones son robustas a las formulaciones alternativas de modelo y datos consideradas en el presente análisis y en análisis previos. 83
86 84 E. PACIFIC BLUEFIN TUNA Tagging studies have shown that there is exchange of Pacific bluefin between the eastern and western Pacific Ocean. Larval, postlarval, and early juvenile bluefin have been caught in the western Pacific Ocean (WPO), but not the eastern Pacific Ocean (EPO), so it is likely that there is a single stock of bluefin in the Pacific Ocean. Most of the catches of bluefin in the EPO are taken by purse seiners. Nearly all of the purse-seine catch is made west of Baja California and California, within about 100 nautical miles of the coast, between about 23 N and 35 N. In recent years a considerable portion of the purse-seine catch of bluefin has been transported to holding pens, where the fish are held for fattening and later sale as sashimi-grade fish. Lesser amounts of bluefin are caught by recreational, gillnet, and longline gear. Bluefin have been caught during every month of the year, but most of the fish are taken during May through October. Bluefin are exploited by various gears in the WPO from Taiwan to Hokkaido. Age-0 fish about 15 to 30 cm in length are caught by trolling during July-October south of Shikoku Island and south of Shizuoka Prefecture. During November-April age-0 fish about 35 to 60 cm in length are taken by trolling south and west of Kyushu Island. Age-1 and older fish are caught by purse seining, mostly during May- September, between about N and E. Bluefin of various sizes are also caught by traps, gillnets, and other gear, especially in the Sea of Japan. Small amounts of bluefin are also caught near the southeastern coast of Japan by longlining. The high-seas longline fisheries are directed mainly at tropical tunas, albacore, and billfishes, but small amounts of Pacific bluefin are caught by these fisheries. Small amounts of bluefin are also caught by Japanese pole-and-line vessels on the high seas. Tagging studies, conducted with conventional and archival tags, have revealed a great deal of information about the life history of bluefin. As stated above, it appears that spawning occurs only in the WPO. Some fish apparently remain their entire lives in the WPO, while others migrate to the EPO. These migrations begin mostly, or perhaps entirely, during the first and second years of life. The first- and secondyear migrants are exposed to various fisheries before beginning their journey to the EPO. The migrants, after crossing the ocean, are exposed to commercial and recreational fisheries off California and Baja California. Eventually, the survivors return to the WPO. Bluefin are most often found in the EPO in waters where the sea-surface temperatures (SSTs) are between 17 and 23 C. Fish 15 to 31 cm in length are found in the WPO in waters where the SSTs are between 24 and 29 C. The survival of larval and early juvenile bluefin is undoubtedly strongly influenced by the environment. Conditions in the WPO probably influence the portions of the juvenile fish there that move to the EPO, and also the timing of these movements. Likewise, conditions in the EPO probably influence the timing of the return of the juvenile fish to the WPO. Various indices of abundance of bluefin in the EPO have been calculated, but none of these is entirely satisfactory. The IATTC calculated habitat and bluefin-vessel indices for the EPO routinely for several years, but the latter indices are no longer calculated due to the abrupt change in the fishery during the early 2000s. A preliminary cohort analysis has indicated that the biomass of the spawning stock was relatively high during the 1960s, decreased during the 1970s and 1980s, and then increased during the 1990s. The recruitment was estimated to be highly variable, with four or five strong cohorts produced during the period. The total catches of bluefin have fluctuated considerably during the last 50 years (Figure E-1). The presence of consecutive years of aboveaverage catches (mid-1950s to mid-1960s) and below-average catches (early 1980s to early 1990s) could be due to consecutive years of above-average and below-average recruitment. The results of yield-per-recruit and cohort analyses indicate that greater catches could be obtained if the catches of age-0 and age-1 fish were reduced or eliminated. Spawner-recruit analyses do not indicate that the recruitment of Pacific bluefin could be increased by permitting more fish to spawn.
87 FIGURE E-1. Retained catches of Pacific bluefin, FIGURA E-1. Capturas retenidas de aleta azul del Pacífico,
88 86 E. ATÚN ALETA AZUL DEL PACÍFICO Estudios de marcado han demostrado que ocurre intercambio de aleta azul del Pacífico entre el Océano Pacífico oriental (OPO) y occidental. Se han capturado aletas azules larvales, poslarvales, y juveniles tempranos en el Pacífico occidental pero no en el OPO, por lo que es probable que exista una sola población de aleta azul en el Océano Pacífico. La mayoría de las capturas de aleta azul en el OPO es realizada por buques cerqueros. Casi toda la captura cerquera proviene de una zona frente a Baja California y California, a menos de unas 100 millas náuticas de la costa, entre 23 N y 35 N. En los últimos años una porción considerable de la captura cerquera de aleta azul ha sido transportada a corrales marinos, donde se mantienen los peces para engordarlos y luego venderlos para sashimi. Se capturan cantidades menores de aleta azul con arte de pesca deportiva, redes de transmalle, y palangres. Se captura la especie en todos los meses del año, pero la mayor parte de la captura es lograda entre mayo y octubre. El aleta azul es pescado con varias artes en el Océano Pacífico occidental desde Taiwán hasta Hokkaido. Peces de 0 años de edad de entre unos 15 y 30 cm de talla son capturados con curricán durante julio-octubre al sur de Shikoku y al sur de la Prefectura de Shizuoka. Durante noviembre-abril peces de edad 0 de entre unos 35 y 60 cm son capturados con curricán al sur y oeste de Kyushu. Peces de edad 1 y mayores son capturados con redes de cerco, principalmente durante mayo-septiembre, entre N y E. Se capturan también aletas azules de varios tamaños con trampas, redes de transmalle, y otras artes de pesca, especialmente en el Mar de Japón. Se capturan también con palangre pequeñas cantidades de la especie cerca del litoral sudeste de Japón. Las pesquerías palangreras de alta mar están dirigidas principalmente hacia los atunes tropicales, la albacora, y los peces picudos, pero capturan pequeñas cantidades de aleta azul del Pacífico. Buques cañeros japoneses capturan asimismo pequeñas cantidades de aleta azul en alta mar. Estudios de marcado, con marcas convencionales y archivadoras, han arrojado una gran cantidad de información sobre el ciclo vital del aleta azul. Tal como se comentó, se supone que el desove ocurre solamente en el Pacífico occidental. Algunos peces permanecen aparentemente toda la vida en el Pacífico occidental, mientras que otros migran al OPO; estas migraciones comienzan principalmente, o tal vez exclusivamente, durante el primer y segundo año de vida. Los migrantes de primer o segundo año están expuestos a varias pesquerías antes de iniciar su migración al OPO. Después de cruzar el océano, están expuestos a las pesquerías comercial y deportiva frente a California y Baja California. Posteriormente, los supervivientes regresan al Pacífico occidental. Se encuentra el aleta azul en el OPO con mayor frecuencia en aguas de entre 17 y 23 C de temperatura de superficie. En el Pacífico occidental se encuentran peces de entre 15 y 31 cm en aguas de entre 24 y 29 C de temperatura de superficie. La supervivencia de las larvas y juveniles tempranos de la especie es indudablemente afectada de manera importante por las condiciones ambientales. Las condiciones en el Pacífico occidental afectan probablemente cuáles porciones de los peces juveniles migran al OPO, y cuándo. Asimismo, las condiciones en el OPO probablemente afectan cuándo los peces juveniles regresan al Pacífico occidental. Se han calculado varios índices de abundancia para el aleta azul en el OPO, pero ninguno es completamente satisfactorio. Durante varios años el personal de la CIAT calculó rutinariamente índices de buque que pesca aleta azul y hábitat para el OPO, pero los últimos ya no se calculan, debido a los cambios bruscos en la pesquería en los primeros años del presente siglo. Un análisis de cohortes preliminar indicó que la biomasa de la población reproductora fue relativamente elevada durante los años 1960, disminuyó durante los años 1970 y 1980, y luego aumentó. Se estimó que el reclutamiento fue altamente variable, con cuatro o cinco cohortes fuertes producidas entre 1960 y Las capturas totales de aleta azul han fluctuado considerablemente en los últimos 50 años (Figura E-1). La presencia de años consecutivos de capturas superiores al promedio (mediados de la década de 1950 a mediados de la siguiente) e inferiores al mismo (principios de los 1980 a principios de los 1990) podría deberse a años consecutivos de reclutamiento superior e inferior al promedio. Los resultados de análisis de rendimiento por recluta y de cohortes indican que sería posible obtener capturas mayores si se redujeran o eliminaran las capturas de peces de edad 0 y de edad 1. Los análisis reproductor-recluta no indican que aumentaría el reclutamiento del aleta azul del Pacífico si se permitiera a más peces desovar.
89 F. ALBACORE TUNA Most scientists who have studied albacore in the Pacific Ocean have concluded that there are two stocks, one occurring in the northern hemisphere and the other in the southern hemisphere. Albacore are caught by longliners in most of the North and South Pacific, but not often between about 10 N and 5 S, by trollers in the eastern and central North Pacific and the central South Pacific, and by pole-and-line vessels in the western North Pacific. In the North Pacific about 60% of the fish are taken in pole-and-line and troll fisheries that catch smaller, younger albacore, whereas about 90% of the albacore caught in the South Pacific is taken by longline. The total annual catches of North Pacific albacore peaked in 1976 at about 125,000 t, and then declined. The catches increased during the 1990s, reaching 121,500 t in 1999 (Figure F-1a). The total annual catches of South Pacific albacore have ranged between about 25,000 and 55,000 t since 1980 (Figure F-1b). Juvenile and adult albacore are caught mostly in the Kuroshio Current, the North Pacific Transition Zone, and the California Current in the North Pacific and the Subtropical Convergence Zone in the South Pacific, but spawning occurs in tropical and subtropical waters, centering around 20ºN and 20ºS latitude. North Pacific albacore are believed to spawn between March and July in the western and central Pacific. The movements of North Pacific albacore are strongly influenced by oceanic conditions, and migrating albacore tend to concentrate along oceanic fronts in the North Pacific Transition Zone. Most of the catches are made in water temperatures between 15º and 19.5ºC. Details of the migration remain unclear, but juvenile fish (2- to 5-year-olds) are believed to move into the eastern Pacific in the spring and early summer, and return to the western and central Pacific, perhaps annually, in the late fall and winter, where they tend to remain as they mature. It has been hypothesized that there are two subgroups of North Pacific albacore, separated at 40ºN in the EPO, with the northern subgroup more likely to migrate to the western and central Pacific Ocean. Less is known about the movements of albacore in the South Pacific Ocean. The juveniles move southward from the tropics when they are about 35 cm long, and then eastward along the Subtropical Convergence Zone to about 130 W. When the fish approach maturity they return to the tropics, where they spawn. Recoveries of tagged fish released in areas east of 155 W were usually made at locations to the east and north of the release site, whereas those of fish released west of 155 W were usually made at locations to the west and north of the release site. New age-structured stock assessments were presented for the South and North Pacific stocks of albacore in 2003 and 2004, respectively. The South Pacific assessment, carried out with MULTIFAN-CL by the Secretariat for the Pacific Community, incorporated catch and effort, length-frequency, and tagging data. The stock was estimated to be well above the level corresponding to the average maximum sustainable yield (AMSY). The catches would continue to increase with further increases in effort, though the extent to which the yield could increase sustainably is not well determined. Although the recent recruitments are estimated to be slightly below average, there currently appears to be no need to restrict the fisheries for albacore in the South Pacific Ocean. Virtual population analyses of the North Pacific stock of albacore were carried out during the 19th North Pacific Albacore Workshop in The estimated 2004 biomass, 438,000 t (Figure F-2), was about 25% greater than that estimated for 1975, the first year of the period modeled. The estimated recruitments since 1990 have generally been greater than those of the 1980s, and the catches per unit effort (CPUEs) for most of the pole-and-line and troll fisheries have increased in recent years. However, the longline CPUEs have declined since the mid-1990s. The Workshop estimated low (0.43) and high (0.68) levels for fishing mortality (F) at full recruitment, and noted that if the rates of F continue at assumed levels, it is unlikely that the spawning stock biomass (SSB) will rebuild to SSB AMSY levels within a 5-year period. The 2005 meeting of the International Scientific Committee of the North Pacific gave the following advice: Future SSB can be maintained at or above the minimum observed SSB (43,000 t in 1977) with F s slightly higher than the current F range. However, the lowest observed SSB estimates all occurred in late 1970 s and may be the least reliable estimates of SSB. A more robust SSB threshold could be based on the lower 10 th or 25 th percentile of observed SSB. If so done, current F should maintain SSB at or above the 10th percentile threshold but a modest reduction from current F may be needed to maintain SSB at or above the 25 th percentile threshold. The IATTC staff considers the higher level for current fishing mortality (0.68) to be more likely, based on the methods used to calculate the estimates. Furthermore, even the high estimate may be too low, given the retrospective bias shown by the model. According to the 2004 North Pacific Albacore Workshop estimates, the higher fishing mortality of 0.68 implies an equilibrium spawning stock biomass at 17% of unfished levels. Projections assuming fishing mortality of 0.68, under low and high scenarios of future recruitment, suggest that the biomass may decline if the current levels of fishing mortality persist. 87


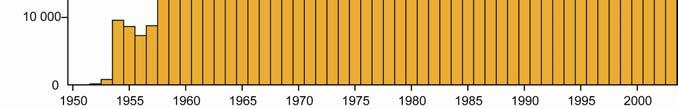
90 88 FIGURE F-1a. Retained catches of North Pacific albacore, FIGURA F-1a. Capturas retenidas de albacora del Pacífico norte, FIGURE F-1b. Retained catches of South Pacific albacore, FIGURA F-1b. Capturas retenidas de albacora del Pacífico sur,
91 FIGURE F-2. Time series of total biomass (B) and spawning stock biomass (SSB) of North Pacific albacore tuna, in metric tons (t), from the North Pacific Albacore Workshop analyses of 2004 and The time series for B are based on January 1 estimates, and those for SSB on estimates at the beginning of the spawning season ( mid-year ). FIGURA F-2. Serie de tiempo de la biomasa total (B) y biomasa de la población reproductora (SSB) del atún albacora del Pacífico Norte, en toneladas métricas (t), de los análisis de la Reunión Técnica sobre el Albacora del Pacífico Norte de 2004 y Las series de tiempo B se basan en estimaciones al 1 de enero, y aquéllas de SSB en estimaciones al principio de la temporada de desove ( medio año ). 89
92 90 F. ATÚN ALBACORA La mayoría de los científicos que estudian el atún albacora en el Océano Pacífico han concluido que existen dos poblaciones, una en el hemisferio norte y la otra en el hemisferio sur. La especie es capturada con palangre en la mayor parte del Pacífico Norte y Sur, pero rara vez entre aproximadamente 10 N y 5 S, con curricán en el Pacífico oriental, Norte central y Sur central, y con caña en el Pacífico Norte occidental. En el Pacífico Norte un 60% del pescado es capturado con caña y curricán, que capturan albacora más joven de menor tamaño, mientras que en el Pacífico Sur un 90% de la captura de albacora es tomada con palangre. Las capturas totales anuales de albacora del Pacífico Norte alcanzaron su nivel máximo de más de t anuales en 1976, y luego disminuyeron. En los años 1990 volvieron a aumentar, y en 1999 alcanzaron t (Figura F-1a). Las capturas anuales totales de albacora del Pacífico Sur han variado entre unas 25 mil y 55 mil t desde 1980 (Figura F-1b). El atún albacora juvenil y adulto es capturado principalmente en la Corriente de Kuroshio, la Zona de Transición del Pacífico Norte, y la Corriente de California en el Pacífico norte y la Zona de Convergencia Subtropical en el Pacífico sur, pero el desove ocurre en aguas tropicales y subtropicales, y se centra en los paralelos de 20ºN y 20ºS. Se cree que el albacora del Pacífico Norte desova entro marzo y julio en el Pacífico occidental y central. Los desplazamientos del albacora del Pacífico Norte son fuertemente afectados por las condiciones oceánicas, y los migrantes suelen estar concentrados en frentes oceánicos en la Zona de Transición del Pacífico Norte. La mayoría de las capturas tienen lugar en aguas de entre 15º y 19.5ºC. No quedan claros los detalles de la migración, pero se cree que peces juveniles (de entre 2 y 5 años de edad) se trasladan al Pacífico oriental en la primavera y a principios del verano, y vuelven al Pacífico occidental y central, tal vez anualmente, a fines de otoño y en el invierno, donde suelen permanecer cuando maduran. Se ha propuesto la hipótesis de dos subgrupos de albacora del Pacífico Norte, separados en 40ºN en el Pacífico oriental, y que el subgrupo del norte tiene la mayor probabilidad de migrar al Pacífico occidental y central. Se sabe menos acerca de los desplazamientos de albacora en el Pacífico sur. Los juveniles se desplazan de los trópicos hacia el sur cuando miden unos 35 cm, y luego hacia el este por la Zona de Convergencia Subtropical hasta aproximadamente 130 O. Poco antes de alcanzar la madurez vuelven a los trópicos, donde desovan. Marcas fijadas en peces liberados al este de 155 O fueron recuperadas generalmente en lugares al este y norte del punto de liberación, mientras que aquéllas fijadas al oeste de 155 O fueron recuperadas generalmente en lugares al oeste y norte del punto de liberación. En 2002 y 2003 fueron presentadas nuevas evaluaciones por edad de las poblaciones de albacora del Pacífico Sur y Norte, respectivamente. La evaluación del Pacífico Sur, realizada con MULTIFAN-CL por la Secretaría de la Comunidad del Pacífico, incorporó datos de captura y esfuerzo, frecuencia de talla, y marcado. Se estimó que la población está bastante por encima del nivel correspondiente al rendimiento máximo sostenible promedio (RMSP). Las capturas seguirían aumentando con aumentos del esfuerzo, aunque no se sabe bien hasta cuál punto el rendimiento podría aumentar de forma sostenible. Aunque se estima que los reclutamientos recientes fueron ligeramente inferiores al promedio, no parece haber en la actualidad ninguna necesidad de limitar la pesca de albacora en el Pacífico Sur. Durante la 19ª Reunión Técnica sobre el Albacora del Pacífico Norte en 2004 se realizaron análisis de poblaciones virtuales de dicha población. La biomasa estimada de 2004, t (Figura F-2), es un 25% mayor que la que se estimó para 1975, el primer año del período modelado. Los reclutamientos estimados desde 1990 fueron generalmente mayores que los de la década de 1980, y las capturas por unidad de esfuerzo (CPUE) de la mayoría de las pesquerías cañeras y curricaneras han aumentado en los últimos años. No obstante, las CPUE palangreras han disminuido desde mediados de los años La reunión estimó tasas de mortalidad por pesca (F) baja (0,43) y alta (0,68) con pleno reclutamiento, y notó que si F continúa en los niveles supuestos, es poco probable que la biomasa de la población reproductora (spawning stock biomass, SSB) se recupere al niveles de SSB RMSP en un período de cinco años. La reunión de 2005 del Comité Científico Internacional del Pacífico Norte (ISC) dio la asesoría siguiente: El SSB futuro puede ser mantenido en el SSB mínimo observado ( t en 1977), o por encima de ese nivel, con F ligeramente más altos que el rango de F actuales. Sin embargo, las estimaciones de SSB más bajas observadas ocurrieron todas a fines de la década de 1970 y podrían ser las estimaciones menos confiables de SSB. Un nivel umbral de SSB más robusto podría basarse en el 10 o 25 percentil inferior del SSB observado. Si se hiciera esto, el F actual debería mantener el SSB en, o por encima de, el umbral del 10 percentil pero una modesta reducción del F actual podría ser necesaria para mantener el SSB en o por encima del umbral del 25 percentil. El personal de la CIAT considera que el nivel más alto de F actual (0,68) es más probable, con base en los métodos usados para calcular las estimaciones. Además, es posible que hasta la estimación alta sea demasiado baja, dado el sesgo retrospectivo demostrado por el modelo. Según las estimaciones de la 19ª Reunión Técnica, la F actual de 0,68 implica una biomasa de equilibrio de la población reproductora en el 17% de los niveles sin explotación, y las proyecciones que suponen una F de 0,68, con escenarios altos y bajos de reclutamiento futuro, sugieren que la biomasa podría disminuir si persisten los niveles actuales de mortalidad por pesca.
93 G. SWORDFISH Swordfish (Xiphias gladius) occur throughout the Pacific Ocean between about 50 N and 50 S. They are caught mostly by the longline fisheries of Far East and Western Hemisphere nations. Lesser amounts are taken by gillnet and harpoon fisheries. They are seldom caught by recreational fishermen. During the most recent three-year period the greatest catches in the EPO have been taken by vessels of Spain, Chile, and Japan, which together harvested about 70% of the total swordfish catch taken in the region. Of these three, Spain and Chile have fisheries that target swordfish, while the swordfish taken in the Japanese fishery are incidental catches of a fishery that predominately targets bigeye tuna. Other nations with fisheries known to target swordfish are Mexico and the United States. Swordfish reach maturity at about 5 to 6 years of age, when they are about 150 to 170 cm in length. They probably spawn more than once per season. Unequal sex ratios occur frequently. For fish greater than 170 cm in length, the proportion of females increases with increasing length. Only fragmentary data are available on the movements of swordfish. They tend to inhabit waters further below the surface during the day than at night. Swordfish tend to inhabit frontal zones. Several of these occur in the eastern Pacific Ocean (EPO), including areas off California and Baja California, off Ecuador, Peru, and Chile, and in the equatorial Pacific. Swordfish tolerate temperatures of about 5 to 27 C, but their optimum range is about 18 to 22 C. Swordfish larvae have been found only at temperatures exceeding 24 C. It is considered, based on fisheries data, that there are two stocks of swordfish in the EPO, one with its center of distribution in the southeastern Pacific Ocean, and the other with its center of distribution off California and Baja California. As well, there may be movement of a northwestern Pacific stock of swordfish into the EPO at various times. The results of genetic studies specifically undertaken to help resolve the question of stock structure are nearing completion. The results of preliminary modeling with MULTIFAN-CL of a North Pacific swordfish stock in areas north of 10 N and west of 135 W indicate that in recent years the biomass level has been stable and well above 50% of the unexploited levels of stock biomass, indicating that swordfish are not overexploited at current levels of fishing effort. The standardized catches per unit of effort (CPUEs) of the longline fisheries in the northern and southern regions of the EPO and trends in relative abundance obtained from them do not indicate declining abundances. Attempts to fit production models to the data failed to produce estimates of management parameters, such as average maximum sustainable yield, under reasonable assumptions of natural mortality rates, due to lack of contrast in the trends. This lack of contrast suggests that the fisheries that have been taking swordfish in these regions have not been of magnitudes sufficient to cause significant responses in the populations. Based on these considerations, and the historically stable catches, it appears that swordfish are not overfished in the northern and southern regions of the EPO. However, there have been increases in effort directed at swordfish and catches of that species by the gillnet and longline fisheries previously mentioned (Figure G-1), and the stocks should be monitored closely for changes in trends in catch and CPUE. The average annual catch during for the northern region has been about 4,800 t, and for the southern region about 9,100 t. It should be noted that catches in the southern region have doubled during this period, reaching 13,300 t in 2002, which exceeded the previous maximum catch of 12,400 t in If the current high levels of catch continue the CPUE will eventually decline. 91

94 92 FIGURE G-1. Retained catches of swordfish in the eastern Pacific Ocean, , by gear type. FIGURA G-1. Capturas retenidas de pez espada en del Océano Pacífico oriental, , por arte de pesca.
95 G. PEZ ESPADA El pez espada (Xiphias gladius) ocurre en todo el Océano Pacífico entre 50 N y 50 S, aproximadamente. Es capturado principalmente por las pesquerías palangreras de países de Lejano Oriente y del hemisferio occidental. Las pesquerías de red de transmalle y arpón capturan cantidades menores. Es rara vez capturado en la pesca deportiva. En los últimos tres años buques de Chile, España y Japón lograron las mayores capturas en el OPO, respondiendo de un 70% de la captura total en la región. El pez espada es el objetivo de las pesquerías española y chilena, mientras que es capturado incidentalmente en la pesquería japonesa, cuyo objetivo principal es el atún patudo. Otras naciones con pesquerías dirigidas hacia el pez espada son México y Estados Unidos. El pez espada alcanza la madurez a la edad de 5 a 6 años, cuando mide unos 150 a 170 cm de talla. Es probable que desove más de una vez por temporada. Ocurren frecuentemente proporciones desiguales de sexos. En el caso de peces de más de 170 cm, la proporción de hembras aumenta con el aumento en la talla. Existen solamente datos fragmentarios sobre los desplazamientos del pez espada. Suele permanecer a mayor profundidad de día que de noche. El pez espada suele vivir en zonas frontales. Hay varias en el Océano Pacífico oriental (OPO), entre ellas zonas frente a California y Baja California, frente a Ecuador, Perú, y Chile, y en el Pacífico ecuatorial. El pez espada tolera temperaturas de entre unos 5 y 27 C, pero su rango óptimo es de 18 a 22 C. Se han encontrado larvas de la especie únicamente a temperaturas de más de 24 C. Se considera, a partir de datos de pesca, que hay dos poblaciones de pez espada en el OPO, una con su centro de distribución en el Pacífico sudeste, y la otra con su centro de distribución frente a California y Baja California. Además, es posible que una población del Pacífico noroeste se desplace al OPO en varias ocasiones. Están casi listos los resultados de estudios genéticos emprendidos específicamente para ayudar a resolver la cuestión de la estructura de la población. Los resultados de un modelado preliminar con MULTIFAN-CL de una población de pez espada del Pacífico Norte en áreas al norte de 10 N y al oeste de 135 O indican que en los últimos años el nivel de biomasa ha sido estable y ha estado por encima del 50% del nivel de la biomasa no explotada, lo cual indica que con los niveles actuales de esfuerzo de pesca, la explotación de la especie no es excesiva. Las tasas de captura por unidad de esfuerzo (CPUE) estandarizadas de las pesquerías palangreras en las regiones norte y sur del OPO, y las tendencias en la abundancia relativa derivadas de las mismas, no señalan que la abundancia esté disminuyendo. Intentos de ajuste de modelos de producción a los datos, con tasas de mortalidad natural razonables supuestas, no produjeron estimaciones de parámetros de ordenación (rendimiento máximo sostenible promedio, por ejemplo), debido a la falta de contraste en las tendencias. Esta falta de contraste sugiere que las pesquerías que capturan pez espada en estas regiones no son de magnitud suficiente como para causar reacciones significativas en la población. A partir de estas consideraciones, y la estabilidad histórica de las capturas, parece que la pesca del pez espada no es excesiva en las regiones norte y sur del OPO. Sin embargo, han ocurrido aumentos en el esfuerzo dirigido hacia el pez espada y las capturas de la especie por las pesquerías de transmalle y palangre antes mencionadas (Figura G-1), y se deberían vigilar cuidadosamente las poblaciones para detectar cambios en las tendencias en las capturas y CPUE. La captura anual media durante fue unas 4,800 t en la región norte y unas 9,100 t en la región sur. Cabe destacar que las capturas en la región sur se duplicaron durante ese período, alcanzando 13,300 t en 2002, más que el récord anterior de 12,400 t en Si continúan los niveles elevados de captura actuales, a la larga la CPUE disminuirá. 93

 have varied over time. Blue marlin are taken by longline vessels of many nations that fish for tunas and billfishes between about 50 N and 50 S.")
96 94 H. BLUE MARLIN The best knowledge currently available indicates that blue marlin (Makaira nigricans) constitutes a single world-wide species and that there is a single stock of blue marlin in the Pacific Ocean. For this reason, statistics on catches (Figure H-1) are compiled, and analyses of stock status are made, for the entire Pacific Ocean, even though it is important to know how the catches in the eastern Pacific Ocean (Figure H-2) have varied over time. Blue marlin are taken by longline vessels of many nations that fish for tunas and billfishes between about 50 N and 50 S. Lesser amounts are taken by recreational fisheries and by various other commercial fisheries. Small numbers of blue marlin have been tagged, mostly by recreational fishermen, with conventional tags. A few of these fish have been recaptured long distances from the locations of release. In addition, blue marlin have been tagged with acoustic tags and their activities monitored for short periods. Blue marlin usually inhabit regions where the sea-surface temperatures (SSTs) are greater than 24 C, and they spend about 90% of their time at depths in which the temperatures are within 1 to 2 of the SSTs. The Deriso-Schnute delay-difference population dynamics model, a form of production model, was used to assess the status of the blue marlin stock in the Pacific Ocean. Data for the estimated annual total retained catches for and standardized catches per unit of effort developed from catch and nominal fishing effort data for the Japanese longline fishery for were used. It was concluded that the levels of biomass and fishing effort were near those corresponding to the average maximum sustainable yield (AMSY). A more recent analysis, using MULTIFAN-CL, was conducted to assess the blue marlin stocks in the Pacific Ocean and to evaluate the efficacy of habitat-based standardization of longline effort. There is considerable uncertainty regarding the levels of fishing effort that would produce the AMSY. However, it was determined that blue marlin in the Pacific Ocean are close to fully exploited, i.e. that the population is near the top of the yield curve. It was also found that standardization of effort, using a habitat-based model, allowed estimation of parameters within reasonable bounds and with reduced confidence intervals about the estimates. The fisheries in the EPO have historically captured about 10 to 18% of the total harvest of blue marlin from the Pacific Ocean, with captures in the most recent 5-year period averaging about 3,800 t, or 10% of the total harvest. FIGURE H-1. Retained catches of blue marlin in the Pacific Ocean, FIGURA H-1. Capturas retenidas de marlín azul en el Océano Pacífico,

97 95 FIGURE H-2. Retained catches of blue marlin in the eastern Pacific Ocean, , by gear type. FIGURA H-2. Capturas retenidas de marlín azul en el Océano Pacífico oriental, , por arte de pesca. H. MARLÍN AZUL La mejor información ahora disponible indica que el marlín azul (Makaira nigricans) constituye una sola especie a nivel mundial, y que existe una sola población de la especie en el Océano Pacífico. Por este motivo, se compilan estadísticas de capturas (Figura H-1), y se realizan análisis de la condición de la población, para el Océano Pacífico entero, aunque es importante saber cómo han variado con el tiempo las capturas en el Pacífico oriental (Figura H-2). El marlín azul es capturado por buques palangreros de muchas naciones que pescan atunes y peces picudos entre aproximadamente 50 N y 50 S. Las pesquerías deportivas y varias otras pesquerías comerciales capturan cantidades menores. Pequeñas cantidades de marlines azules han sido marcadas con marcas convencionales, principalmente por pescadores deportivos. Algunos de estos peces han sido recapturados a grandes distancias del punto de liberación. Además, se han marcado marlines azules con marcas acústicas y se han seguido sus actividades durante períodos cortos. El marlín azul vive generalmente en regiones con temperaturas superficiales del mar (TSM) de más de 24 C, y pasa un 90% del tiempo a profundidades donde la temperatura es de 1 a 2 menos que la TSM. Se usó el modelo de poblaciones con retardos temporales de Deriso y Schnute, una forma de modelo de producción, para evaluar la condición de la población de marlín azul en el Océano Pacífico. Se usaron datos de las capturas anuales totales estimadas para y la captura por unidad de esfuerzo estandarizada elaborada de datos de captura y esfuerzo de pesca nominal de la pesquería palangrera japonesa de Se concluyó que los niveles de biomasa y esfuerzo de pesca eran cercanos a aquéllos correspondientes al rendimiento máximo sostenible promedio (RMSP). Un análisis más reciente, usando MULTIFAN-CL, fue realizado para evaluar las poblaciones de marlín azul en el Océano Pacífico y evaluar la eficacia de la estandarización basada en hábitat del esfuerzo palangrero. Existe una incertidumbre considerable con respecto a los niveles de esfuerzo de pesca que producirían el RMSP. Sin embargo, se determinó que marlín azul en el Océano Pacífico está casi plenamente explotado, es decir, la población está cerca de la cima de la curva de rendimiento. Se descubrió también que la estandarización del esfuerzo, usando un modelo basado en hábitat, permitió estimar los parámetros dentro de límites razonables y con intervalos de confianza reducidos alrededor de las estimaciones. Históricamente, las pesquerías en el OPO han capturado del 10 al 18% de la captura total de marlín azul del Océano Pacífico; en el quinquenio más reciente fueron en promedio unas toneladas, o un 10% de la captura total.
98 96 I. STRIPED MARLIN Striped marlin (Tetrapturus audax) occur throughout the Pacific Ocean between about 45 N and 45 S. They are caught mostly by the longline fisheries of Far East and Western Hemisphere nations. Lesser amounts are caught by recreational, gillnet, and other fisheries. During recent years the greatest catches (Figure I-1) in the eastern Pacific Ocean (EPO) have been taken by fisheries of Costa Rica, Japan, and the Republic of Korea. Striped marlin reach maturity when they are about 140 cm long, and spawning occurs in widely-scattered areas of the Pacific Ocean. The stock structure of striped marlin in the Pacific Ocean is not well known. There are indications that there is only limited exchange of striped marlin between the EPO and the central and western Pacific Ocean, so it is considered in this report that examinations of local depletions and independent assessments of the striped marlin of the EPO are meaningful. An analysis of trends in catches per unit of effort in several subareas suggest that the fish in the EPO constitute a single stock. Genetic studies have suggested that there are separate populations in the eastern and western South Pacific and that there may be a separate populations with centers of distribution in the regions proximate to Hawaii in the north-central Pacific and to Ecuador and to Mexico in the EPO. However, preliminary results of more recent analyses suggest that the fish in the Ecuador and Mexico region are from a single population. Few tagging data are available for striped marlin. Most recaptures of tagged fish released off the tip of the Baja California peninsula have been made in the general area of release, but some have been recaptured around the Revillagigedo Islands, a few around Hawaii, and one near Norfolk Island, north of New Zealand. Such being the case, the conclusions reached for a single-stock model, chosen on the basis of trends in catch rates, should be considered tentative, and efforts should be undertaken to resolve the question of stock structure of striped marlin in the EPO. To this end, a collaborative study to investigate the stock structure and status of striped marlin in the Pacific has been undertaken. Standardized catch rates were obtained from a general linear model and from the statistical habitat-based standardization method. Analyses of stock status made using two production models, taking into account the time period when billfish were targeted by longline fishing in the EPO, were considered the most plausible. A Pella-Tomlinson model yielded estimates of the average maximum sustained yield (AMSY) in the range of 3,700 to 4,100 t, with a current biomass to be about 47% of the unfished biomass. The current biomass is estimated to be greater than the biomass that would produce the AMSY. An analysis, using the Deriso-Schnute delay-difference model, yielded estimates of AMSY in the range of 8,700 to 9,200 t, with the current biomass greater than that needed to produce the AMSY and about 70% of the size of the unexploited biomass. The catches and standardized fishing effort for striped marlin decreased in the EPO from through 1998, and this decline has continued, with annual catches during 2000 to 2003 between about 2,000 and 2,100 t, levels that are well below estimated AMSY harvest levels. This may result in a continued increase in the biomass of the stock in the EPO. The stock(s) of striped marlin in the EPO are apparently in good condition, with current and near-term anticipated fishing effort less than that corresponding to the AMSY.

99 FIGURE I-1. Retained catches of striped marlin in the eastern Pacific Ocean, , by gear type. FIGURA I-1. Capturas retenidas de marlín rayado en el Océano Pacífico oriental, , por arte de pesca. 97
100 98 I. MARLÍN RAYADO El marlín rayado (Tetrapturus audax) ocurre por todo el Océano Pacífico entre 45 N y 45 S. Es capturado principalmente por las pesquerías palangreras de naciones de Lejano Oriente y del hemisferio occidental. Las pesquerías de red de transmalle, deportiva, y otras capturan cantidades menores. En años recientes las pesquerías de la República de Corea, Costa Rica, y Japón han realizado las mayores capturas en el Océano Pacífico oriental (OPO) (Figura I-1). El marlín rayado alcanza la madurez cuando mide unos 140 cm de talla, y el desove ocurre en zonas ampliamente esparcidas del Océano Pacífico. La estructura de la población de marlín rayado es incierta. Existen indicaciones de que ocurre solamente intercambio limitado de la especie entre el OPO y el Pacífico central y occidental, por lo que se considera en este informe que estudios de reducciones locales y evaluaciones independientes del marlín rayado del OPO son importantes. Un análisis de las tendencias de las captura por unidad de esfuerzo en varias subáreas señaló que los peces en el OPO constituyen una sola población. Estudios genéticos sugirieron que hay poblaciones separadas en el Pacífico Sur oriental y occidental y que pudiera haber poblaciones separados centradas en la región cerca de Hawai en el Pacífico central norte y cerca de Ecuador y México en el OPO, pero los resultados preliminares de análisis más recientes sugieren que los peces en la región de Ecuador y México son de una sola población. Se dispone de pocos datos de marcado del marlín rayado. Se realizó la mayoría de las recapturas de peces marcados liberados frente a la punta de la península de Baja California en la misma zona general de liberación, pero otros fueron recapturados cerca de las Islas Revillagigedo, otros cerca de Hawai, y uno cerca de la Isla de Norfolk, al norte de Nueva Zelanda. Por estos motivos las conclusiones alcanzadas por un modelo de una sola población, seleccionado sobre la base de tendencias en tasas de captura, deben ser consideradas preliminares, y se deberían emprender esfuerzos por resolver la cuestión de la estructura de la población de marlín rayado en el OPO. Con este fin se ha iniciado un estudio conjunto para investigar la estructura de la población y la condición del marlín rayado en el Pacífico. Se obtuvieron tasas de captura estandarizadas de un modelo lineal general y del método estadístico de estandarización basado en hábitat. Análisis de la condición de la población realizados con dos modelos de producción, tomando en cuenta el período cuando peces picudos eran objetivo de la pesca palangrera en el OPO, fueron considerados los más verosímiles. Un modelo de Pella-Tomlinson produjo estimaciones del rendimiento máximo sostenible promedio (RMSP) de entre 3,700 y 4,100 t, con la biomasa actual en un 47% de la biomasa no explotada. Se estima que la biomasa actual es mayor que la que produciría el RMSP. Un análisis usando el modelo con retardos temporales de Deriso y Schnute produjo estimaciones de RMSP de entre 8,700 y 9,200 t, con la biomasa actual mayor que la necesaria para producir el RMSP y un 70% del tamaño de la biomasa no explotada. Las capturas y el esfuerzo de pesca estandarizado de marlín rayado disminuyeron en el OPO entre y 1998, y esta disminución ha continuado, alcanzando niveles bajos récord en las estimaciones preliminares de capturas retenidas durante de unas a toneladas, nivel muy inferior a los niveles estimados de captura de RMSP. Esto podría resultar en un aumento continuado de la biomasa de la población en el OPO. La población de marlín rayado en el OPO está aparentemente en buenas condiciones, con el esfuerzo de pesca actual y anticipado a corto plazo inferior al nivel correspondiente al RMSP.
101 J. ECOSYSTEM CONSIDERATIONS 1. Introduction Impact of catches Other ecosystem components Trophic interactions Physical environment Aggregate indicators Ecosystem modeling Actions by the IATTC and the AIDCP addressing ecosystem considerations Future developments INTRODUCTION The FAO Code of Conduct for Responsible Fisheries provides that management of fisheries should ensure the conservation not only of target species, but also of the other species belonging to the same ecosystem. In 2001, the Reykjavik Declaration on Responsible Fisheries in the Ecosystem elaborated this standard with a commitment to incorporate an ecosystem approach into fisheries management. The IATTC has taken account of ecosystem issues in many of its decisions, but until recently has not focused its attention on the entire ecosystem in which the target species, the tunas and billfishes, reside. This section provides a coherent view, summarizing what is known about the direct impact of the fisheries upon various species and species groups of the ecosystem, and reviews what is known about the environment and about other species that are not directly impacted by the fisheries. The purpose is to provide the Commission with the opportunity to consider the entire ecosystem as part of its consideration of the status of the tuna and billfish stocks and management measures. This review does not suggest objectives for the incorporation of ecosystem considerations into the management of tuna or billfish fisheries, nor any new management measures. Rather, its prime purpose is to offer the Commission the opportunity to ensure that ecosystem considerations are clearly part of its agenda. It is important to remember that the view that we have of the ecosystem is based on the recent past; we have almost no information about the ecosystem before exploitation began. Also, the environment is subject to change on a variety of time scales, including the well-known El Niño fluctuations and more recently recognized longer-term changes, such as the Pacific Decadal Oscillation and other climate changes. In addition to reporting the catches of the principal species of tunas and billfishes, the staff has reported the bycatches of other species that are normally discarded. In this section, data on these bycatches are presented in the context of the effect of the fishery on the ecosystem. Unfortunately, while relatively good information is available for the tunas and billfishes, information for the entire fishery is not available. The information is comprehensive for large (carrying capacity greater than 363 metric tons) purse seiners that carry observers under the Agreement on the International Dolphin Conservation Program (AIDCP), and information on retained catches is also reported for other purse seiners, pole-and-line vessels, and much of the longline fleet. Some information is available on sharks that are retained by parts of the longline fleet. Information on bycatches and discards is also available for large purse-seiners, and for some smaller ones. There is little information available on the bycatches and discards for other fishing vessels. 2. IMPACT OF CATCHES 2.1. Single-species assessments This section provides a summary of current information on the effects of the tuna fisheries on the stocks of individual species in the eastern Pacific Ocean (EPO). It focuses on the current biomass of each stock considered, compared to what it might have been in the absence of a fishery. The intention is to show how the fishery may have altered the components of the ecosystem, rather than the detailed assessments, which can be found in other sections of this report and in other Commission documents. The section below frequently refers to comparisons with the estimated unexploited stock size. There are no direct measurements of the unexploited stock size, and, in any case, it would have varied from year to year Tunas a Yellowfin (Thunnus albacares) Since 1984 the yellowfin stock has been close to or above the level corresponding to the average maximum sustainable yield. To meet this objective, the spawning stock size must be kept above 44% of its unexploited size with the current mix of fishing methods. One estimate of the effect of this reduced stock size is that the predation by yellowfin on other parts of the ecosystem is reduced to about 30% of what it 99
102 100 was in the absence of a fishery b Skipjack (Katsuwonus pelamis) Skipjack assessments are far less certain than those for yellowfin and bigeye, in part because the fishery in the EPO does not appear to be having much impact on the stock. However, it appears that fluctuations in recruitment cause large variations in stock size. In 2003, the biomass was estimated to be about 60% of what it would have been in the absence of a fishery and under average conditions c Bigeye (Thunnus obesus) Up to 1993 bigeye were taken mostly by longline fishing. The stock size in 1993 is estimated to have been 30% of its unexploited size. After 1993, purse seining for tunas associated with fish-aggregating devices (FADs) took significant quantities of small and medium-sized bigeye. Currently, after several years of poor recruitment and excessive levels of fishing mortality, the stock size is estimated to be at about 13% of its unexploited size. The biomass estimated for 2005 is near the lowest since 1975, the first year included in the model d Albacore (Thunnus alalunga) It is generally considered that there are two stocks of albacore in the Pacific Ocean, one in the North Pacific and the other in the South Pacific. An assessment for South Pacific albacore, done by the Secretariat of the Pacific Community in 2003, showed that the South Pacific stock was at about 60% of its unexploited size. An assessment by the 19th North Pacific Albacore Workshop in 2004 indicated the North Pacific stock to be at about 45% of its unexploited size Billfishes a Swordfish (Xiphias gladius) The variations in standardized catch per unit of effort (CPUE) of swordfish in the northern and southern EPO show no trend, suggesting that catches to date have not affected the stocks significantly, though recent catches have been near record levels b Blue marlin (Makaira nigricans) Recent stock assessments of blue marlin suggest that the current stock size is between 50 and 90% of the unexploited stock size c Striped marlin (Tetrapturus audax) A recent stock assessment of striped marlin suggests that the current stock size is about 50 to 70% of the unexploited stock size d Black marlin (Makaira indica), sailfish (Istiophorus platypterus), and shortbill spearfish (Tetrapturus angustirostris) No recent formal stock assessments have been made for these species, although there are some data presented in the IATTC Bulletin series published jointly by scientists of the National Research Institute of Far Seas Fisheries (NRIFSF) of Japan and the IATTC that show trends in catches, effort, and CPUEs Summary The estimated catches (including purse-seine discards), in metric tons, of tunas and billfishes in the EPO during 2004 are as follows. PS OBJ NOA DEL LP LL OTR Total Yellowfin tuna 25, , ,611 1,905 2,041 1, ,597 Skipjack tuna 99, ,882 7, ,855 Bigeye tuna 65,171 3, , ,290 Albacore tuna ,509 7,676 19,291 Swordfish , ,964 Blue marlin Striped marlin Black marlin Sailfish Shortbill spearfish <1 <1 < < Marine mammals Marine mammals, especially spotted dolphins (Stenella attenuata), spinner dolphins (S. longirostris), and common dolphins (Delphinus
103 delphis), are frequently found associated with yellowfin tuna in the size range of about 10 to 40 kg in the EPO. Purse-seine fishermen have found that their catches of yellowfin in the EPO can be maximized by setting their nets around herds of dolphins and the associated schools of tunas, and then releasing the dolphins while retaining the tunas. The incidental mortality of dolphins in this operation was high during the early years of the fishery, but after the late 1980s it decreased precipitously. Preliminary mortality estimates of dolphins in the fishery in 2004 are as follows: Species and stock Incidental mortality Number Metric tons Offshore spotted dolphin Northeastern Western-southern Spinner dolphin Eastern Whitebelly Common dolphin Northern Central Southern Other dolphins Total 1, Studies of the association of tunas with dolphins have been an important component of the staff s long-term approach to understanding key interactions in the ecosystem. The extent to which yellowfin tuna and dolphins compete for resources, or whether either or both of them benefits from the interaction, remain critical pieces of information, given the large biomasses of both groups and their high rates of prey consumption. The populations of dolphins involved in the purse-seine fishery were reduced from their unexploited levels during the 1960s and 1970s, but there is now evidence of their slow recovery. During 2003, scientists of the U.S. National Marine Fisheries Service (NMFS) conducted the latest in a series of research cruises under the Stenella Abundance Research Project (STAR). The primary objective of the multi-year study is to investigate trends in population size of the dolphins that have been taken as incidental catch by the purse-seine fishery in the EPO. During STAR 2003, data on cetacean distribution, herd size, and herd composition were collected to estimate dolphin abundance. These data are currently being analyzed. Scientists of the NMFS have made estimates of the abundances of several other species of marine mammals based on data from research cruises made between 1986 and 2000 in the EPO. The STAR 2003 cruises will provide further estimates of abundance of these mammals. Of the species not significantly affected by the tuna fishery, short-finned pilot whales (Globicephala macrorhynchus) and three stocks of common dolphins showed increasing trends in abundance during that 15-year period. The apparent increased abundance of these mammals may have caused a decrease in the carrying capacity of the EPO for other predators that overlap in diet, including spotted dolphins. Bryde s whales (Balaenoptera edeni) also increased in estimated abundance, but there is very little diet overlap between these baleen whales and the upper-level predators impacted by the fisheries. Striped dolphins (Stenella coeruleoalba) showed no clear trend in estimated abundance over time, and the estimates of abundance of sperm whales (Physeter macrocephalus) tended to decrease in recent years. Some marine mammals are adversely affected by reduced food availability during El Niño events, especially in coastal ecosystems. Examples that have been documented include dolphins, pinnipeds, and Bryde s whales off Peru, and pinnipeds around the Galapagos Islands. Large whales are able to move in response to changes in prey productivity and distribution Sea turtles Sea turtles are caught on longlines when they take the bait on hooks, are snagged accidentally by hooks, or are entangled in the lines. Estimates of incidental mortality of turtles due to longline and gillnet fishing are few. At the 4th meeting of the IATTC Working Group on Bycatch in January 2004, it was reported that 166 leatherback (Dermochelys coriacea) and 6,000 other turtle species, mostly olive Ridley (Lepidochelys olivacea), were incidentally caught by Japan s longline fishery in the EPO during 2000, and that, of these, 25 and 3,000, respectively, were dead. The mortality rates due to longlining in the EPO are likely to be similar for other fleets targeting bigeye tuna, and "Other dolphins" includes the following species and stocks, whose observed mortalities were as follows: striped dolphins, 5 (0.5 t); coastal spotted dolphin, 9 (0.5 t), Central American spinner dolphin (Stenella longirostris centroamericana) 7 (0.3 t); roughtoothed dolphin (Steno bredanensis) 1 (0.2 t); unidentified dolphins, 34 (1.7 t).
104 102 possibly greater for those that set lines at shallower depths for albacore and swordfish. About 23 million of the 200 million hooks set each year in the EPO by distant-water longline vessels target swordfish with shallow longlines. In addition, there is a sizeable fleet of local longline vessels that fish for tunas and billfishes in the EPO. During 2004 the IATTC staff and some other organizations rendered advice and assistance to the Ecuadorian government s program to reduce the mortality of sea turtles caused by the artisanal longline fishery for tunas and other species. Similar programs are in their initial stages in other Latin American nations bordering on the Pacific Ocean. Additional information on this program can be found in Section 8.2. Sea turtles are occasionally caught in purse seines in the EPO tuna fishery. Most interactions occur when the turtles associate with floating objects, and are captured when the object is encircled. In other cases, nets set around unassociated schools of tunas or schools associated with dolphins may capture sea turtles that happen to be at that location. The olive Ridley turtle is, by far, the species of sea turtle taken most often by purse seiners. It is followed by black or green sea turtles (Chelonia agassizi), and, very occasionally, by loggerhead (Caretta caretta) and hawksbill (Eritmochelys imbricata) turtles. Only one mortality of a leatherback turtle has been recorded during the 10 years that IATTC observers have been recording this information. Some of the turtles are unidentified because they were too far from the vessel or it was too dark for the observer to identify them. Sea turtles, at times, become entangled in the webbing under fish-aggregating devices (FADs) and drown. In some cases, they are entangled by the fishing gear and may be injured or killed. The estimated mortalities (in numbers) of turtles caused by large purse-seine vessels during 2004 were as follows: Set type OBJ NOA DEL Olive Ridley Black or eastern Pacific green Loggerhead Hawksbill Leatherback Unidentified Total Average number of sets 5,083 5,699 11,783 The mortalities of sea turtles due to purse seining for tunas are probably less than those due to other types of human activity, which include exploitation of eggs and adults, beach development, pollution, entanglement in and ingestion of marine debris, and impacts of other fisheries. The populations of olive Ridley, black, and loggerhead turtles are designated as endangered, and those of the hawksbill and leatherback turtles as critically endangered, by the International Union for the Conservation of Nature Sharks and other large fishes Sharks and other large fishes are taken by both purse-seine and longline vessels. Silky sharks (Carcharhinus falciformis) are the most commonly-caught species of shark in the purse-seine fishery. The longline fisheries also take significant quantities of silky sharks, and a Pacific-wide analysis of longline and purse-seine fishing is necessary to estimate the impact of fishing on the stock(s). Preliminary estimates of indices of relative abundance of large silky sharks, based on the purse-seine data, show a decreasing trend over the period for each of the three types of purse-seine sets. It is not known whether this decreasing trend is due to the fisheries, changes in the environment (perhaps associated with the El Niño event), or other processes. The trend does not appear to be due to changes in the density of floating objects. A stock assessment for blue sharks (Prionace glauca) in the North Pacific has been conducted by scientists of the U.S NMFS and the NRIFSF of Japan. Preliminary results provided a range of plausible values for maximum sustainable yield (MSY) of 1.8 to nearly 4 times the current catch of blue shark per year. This work indicates that under the 2001 fishing regime in the North Pacific, the blue shark population appears to be in no danger of collapse. The discards (in metric tons) of sharks and other large fishes in the EPO during 2004, other than those discussed above, by large purseseine vessels are as follows. Complete data are not available for small purse-seine, longline, and other types of vessels.
105 Set type OBJ NOA DEL Dorado (Coryphaena spp.) 2, Wahoo (Acanthocybium solandri) 1, Rainbow runner (Elagatis bipinnulata) and yellowtail (Seriola lalandi) <1 Sharks Rays (Mobulidae and Dasyatidae) Billfishes Other large fishes 5 <1 <1 Apart from the assessments of billfishes, summarized in Sections G-I of this report, and blue shark there are no stock assessments available for these species in the EPO, and hence the impacts of the bycatches on the stocks are unknown. The catch rates of species other than tunas in the purse-seine fishery are different for each type of set. With a few exceptions, the bycatch rates are greatest in sets on floating objects, followed by unassociated sets and, at a much lower level, dolphin sets. Dolphin bycatch rates are greatest for dolphin sets, followed by unassociated sets and, at a much lower level, floating-object sets. The bycatch rates of sailfish, manta rays (Mobulidae), and stingrays (Dasyatidae) are greatest in unassociated sets, followed by dolphin sets and then floating-object sets. Because of these differences, it is necessary to follow the changes in frequency of the different types of sets to interpret the changes in bycatch figures. The estimated numbers of purse-seine sets of each type in the EPO during are shown in Table A OTHER ECOSYSTEM COMPONENTS 3.1. Seabirds There are approximately 100 species of seabirds in the tropical EPO. Some seabirds associate with subsurface predators, such as fishes (especially tunas) and marine mammals. Subsurface predators often drive prey to the surface to trap them against the air-water interface, where the prey become available to the birds. Most species of seabirds take prey within a half meter of the sea surface or in the air (flyingfishes (Exocoetidae) and flying squid (Ommastrephidae)). In addition to driving the prey to the surface, subsurface predators make prey available to the birds by injuring or disorienting the prey and by leaving scraps after feeding on large prey. Feeding opportunities for some seabird species are dependent on the presence of tuna schools feeding at the surface. Seabirds are affected by the variability of the ocean environment. During the El Niño event, seabird populations throughout the tropical and northeastern Pacific Ocean experienced breeding failures and mass mortalities, or migrated elsewhere in search of food. Some species, however, are apparently not affected by El Niño episodes. In general, seabirds that forage in upwelling areas of the tropical EPO and Peru Current suffer reproductive failures and mortalities due to food shortage during El Niño events, while seabirds that forage in areas less affected by El Niño episodes may be relatively unaffected. According to the Report of the Scientific Research Program under the U.S. International Dolphin Conservation Program Act, prepared by the U.S. NMFS in September 2002, there were no significant temporal trends in abundance estimates over the period for any species of seabird, except for a downward trend for the Tahiti petrel (Pseudobulweria rostrata), in the tropical EPO. Some seabirds are susceptible to being caught on baited hooks in the pelagic longline fisheries. Data on the bycatch of black-footed albatross (Phoebastria nigripes) by the U.S. pelagic longline fishery in the central North Pacific Ocean have been analyzed, but comparable data for the longline fisheries in the EPO were not available. In an externally-funded study, the IATTC staff is currently investigating the population status of the black-footed albatross in the entire North Pacific Ocean, taking into account the effects of fisheries bycatch Forage The forage taxa occupying the middle trophic levels in the EPO are obviously an important component of the ecosystem, providing a link between primary production at the base of the food web and the upper-trophic-level predators, such as tunas and billfishes. The indirect effects of environmental variability are transmitted to the upper trophic levels through the forage taxa. Little is known, however, about fluctuations in abundance of the large variety of prey species in the EPO. Scientists from the U.S. NMFS have recorded data on the distributions and abundances of common prey groups, including lanternfishes (Myctophidae), flyingfishes, and some squids, in the tropical EPO during and Mean abundance estimates for all fish taxa, and to a lesser extent for squids, increased from 1986 through Estimates were low again in 1998, and then increased through Their interpretation of this pattern was that El Niño events in and had negative effects on these prey populations. More data on these taxa were collected during the NMFS STAR 2003 cruises, and are currently being analyzed. 103
106 104 Some small fishes, many of which are forage for the larger predators, are incidentally caught by purse-seine vessels in the EPO. Frigate and bullet tunas (Auxis spp.), for example, are a common prey of many of the animals that occupy the upper trophic levels in the tropical EPO. In the tropical EPO ecosystem model (Section 6), frigate and bullet tunas comprise 10% or more of the diet of eight predator categories. Small quantities of frigate and bullet tunas are captured by purse-seine vessels on the high seas and by artisanal fisheries in some coastal regions of Central and South America. The vast majority of frigate and bullet tunas captured by tuna purse-seine vessels is discarded at sea. The estimated discards, in metric tons, of small fishes by large purse-seine vessels with observers aboard in the EPO during 2004 were as follows: Set type OBJ NOA DEL Triggerfishes (Balistidae) and filefishes (Monacanthidae) Other small fishes 17 1 <1 Frigate and bullet tunas (Auxis spp.) Larval fishes and plankton Larval fishes have been collected by manta (surface) net tows in the EPO for many years by personnel of the Southwest Fisheries Science Center of the U.S. NMFS. Of the 314 taxonomic categories identified, 17 were found to be most likely to show the effects of environmental change. The occurrence, abundance, and distribution of these key taxa revealed no consistent temporal trends. The phytoplankton and zooplankton populations in the tropical EPO are variable. For example, chlorophyll concentrations on the sea surface (an indicator of phytoplankton blooms) and the abundance of copepods were markedly reduced during the El Niño event of , especially west of 120 W. Similarly, surface concentrations of chlorophyll decreased during the El Niño episode and increased during the 1988 La Niña event due to changes in nutrient availability. The species and size composition of zooplankton is often more variable than the zooplankton biomass. When the water temperatures increase, warm-water species often replace cold-water species at particular locations. The relative abundance of small copepods off northern Chile, for example, increased during the El Nino event, while the zooplankton biomass did not change. 4. TROPHIC INTERACTIONS Tunas and billfishes are wide-ranging, generalist predators with high energy requirements, and, as such, are key components of pelagic ecosystems. The ecological relationships among large pelagic predators, and between them and animals at lower trophic levels, are not well understood. Given the need to evaluate the implications of fishing activities on the underlying ecosystems, it is essential to acquire a reliable understanding of the trophic structure in open-ocean ecosystems, and the natural variability forced by the environment. Knowledge of the trophic ecology of predator fishes has historically been derived from diet studies. Tunas that feed inshore utilize different prey than those caught offshore. For example, yellowfin and skipjack caught off Baja California feed heavily on red crabs (Pleuroncodes planipes). The most-common prey item for yellowfin tuna caught by purse seines offshore are frigate and bullet tunas, squids and argonauts (cephalopods), and flyingfishes and other epipelagic fishes. Bigeye tuna feed at greater depths than do yellowfin and skipjack, and consume primarily cephalopods and mesopelagic fishes. The most important prey of skipjack are euphausiid crustaceans. Recently, diet studies have become focused on understanding resource partitioning among the predator communities, comprising tunas, sharks, billfishes, dorado, wahoo, rainbow runner, and others, captured by purse seiners. In general, considerable resource partitioning occurs among the components of these communities. Stomach contents, however, provide only a relative snapshot of the most recent meal at the time of day an animal is captured, and under the conditions required for its capture. A more-recent method utilizes stable isotopes of carbon and nitrogen to investigate trophic relations. Stable carbon and nitrogen isotopes integrate information on all components of the diet into the animal s tissues, providing a recent history of trophic interactions and information on the structure and dynamics of ecological communities. This technology is now being applied in the pelagic EPO, and preliminary results suggest that potentially important components of the food web may not be represented in diet analyses of the principal predators. 5. PHYSICAL ENVIRONMENT 6 Environmental conditions affect marine ecosystems, the dynamics and catchability of tunas and billfishes, and the activities of the fishermen. Tunas and billfishes are pelagic during all stages of their lives, and the physical factors that affect the tropical and sub-tropical 6 Much of the information in this section is from Fiedler, P.C Environmental change in the eastern tropical Pacific Ocean: review of ENSO and decadal variability. Mar. Ecol. Prog. Ser. 244:
107 Pacific Ocean can have important effects on their distribution and abundance. Environmental conditions are thought to cause considerable variability in the recruitment of tunas and billfishes. Stock assessments by the IATTC have often included the assumption that oceanographic conditions might influence recruitment in the EPO. Different types of climate perturbations may impact fisheries differently. It is thought that a shallow thermocline in the EPO contributes to the success of purse-seine fishing for tunas, perhaps by acting as a thermal barrier to schools of small tunas, keeping them near the sea surface. When the thermocline is deep, as during an El Niño event, tunas seem to be less vulnerable to capture, and the catch rates have declined. Warmer- or cooler-than-average sea-surface temperatures (SSTs) can also cause these mobile fishes to move to more favorable habitats. The ocean environment varies on a variety of time scales, from seasonal to interannual, decadal, and longer (e.g. climate phases or regimes). The dominant source of variability in the upper layers of the EPO is often called the El Niño-Southern Oscillation (ENSO). The ENSO is an irregular fluctuation involving the entire tropical Pacific Ocean and global atmosphere. It results in variations of the winds, rainfall, thermocline depth, circulation, biological productivity, and the feeding and reproduction of fishes, birds, and marine mammals. El Niño events occur at 2- to 7-year intervals, and are characterized by weaker trade winds, deeper thermoclines, and abnormally-high SSTs in the equatorial EPO. El Niño s opposite phase, often called La Niña, is characterized by stronger trade winds, shallower thermoclines, and lower SSTs. Research has documented a connection between the ENSO and the rate of primary production, phytoplankton biomass, and phytoplankton species composition. Upwelling of nutrient-rich subsurface water is reduced during El Niño episodes, leading to a marked reduction in primary and secondary production. ENSO also directly affects animals at middle and upper trophic levels. Researchers have concluded that the El Niño event, for example, deepened the thermocline and nutricline, decreased primary production, reduced zooplankton abundance, and ultimately reduced the growth rates, reproductive successes, and survival of various birds, mammals, and fishes in the EPO. In general, however, the ocean inhabitants recover within short periods because their life histories are adapted to respond to a variable habitat. Variability on a decadal scale (i.e. 10 to 30 years) also affects the EPO. During the late 1970s there was a major shift in physical and biological states in the North Pacific Ocean. This climate shift was also detected in the tropical EPO by small increases in SSTs, weakening of the trade winds, and a moderate change in surface chlorophyll levels. Some researchers have reported another major shift in the North Pacific in Climate-induced variability in the ocean has often been described in terms of regimes, characterized by relatively stable means and patterns in the physical and biological variables. Analyses by the IATTC staff have indicated that yellowfin tuna in the EPO have experienced a lower recruitment regime ( ) and a higher recruitment regime (1984-present). The increased recruitment during the latter period is thought to be due to a shift to a higher productivity regime in the Pacific Ocean. Decadal fluctuations in upwelling and water transport are simultaneous to the higher-frequency ENSO pattern, and have basin-wide effects on the SSTs and thermocline slope that are similar to those caused by ENSO, but on longer time scales. Environmental variability in the tropical EPO is manifested differently in different regions in which tunas are caught. For example, SST anomalies in the tropical EPO warm pool (5 to 20 N, east of 120 W) have been about one-half the magnitude and several months later than those in the equatorial Pacific NIÑO3 area (5 S to 5 N, 90 to 150 W). 6. AGGREGATE INDICATORS Recognition of the consequences of fishing for marine ecosystems has stimulated considerable research in recent years. Researchers ask how the use of performance measures and reference points might be expanded to help meet the objectives of ecosystem-based fisheries management. Whereas reference points to date have been used primarily for single-species management of target species, applying performance measures and reference points to non-target species is believed to be a tractable first step. Current examples include incidental mortality limits for dolphins in the EPO purse-seine fishery under the AIDCP. Another area of interest is whether useful performance indicators based on ecosystem-level properties might be developed. Several ecosystem metrics or indicators, including community size structure, diversity indices, species richness and evenness, overlap indices, catch trophic spectra, relative abundance of an indicator species or group, and numerous environmental indicators, have been proposed. Whereas there is general agreement that multiple system-level indicators should be used, there is concern over whether there is sufficient practical knowledge of the dynamics of such metrics and whether a theoretical basis for identifying precautionary or limit reference points based on ecosystem properties exists. Ecosystem-level metrics are not yet commonly used for managing fisheries. Food web diagrams are useful for representing the structure and flows of ecosystems. Trophic levels (TLs) are used in food-web ecology to characterize the functional role of organisms and to facilitate estimates of energy or mass flow through communities. A simplified foodweb diagram, with approximate TLs, of the pelagic tropical EPO, is shown in Figure J-1. Toothed whales (Odontoceti, average TL 5.2), large squid predators (large bigeye tuna and swordfish, average TL 5.2) and sharks (average TL 5.0) are top-level predators. Other tunas, large piscivores, dolphins, and seabirds occupy slightly lower TLs. Smaller epipelagic fishes (e.g. Auxis spp. and flyingfishes), 105
108 106 cephalopods, and mesopelagic fishes are the principal forage of many of the upper-level predators in the ecosystem. Small fishes and crustaceans prey on two zooplankton groups, and the herbivorous microzooplankton (TL = 2) feed on the producers, phytoplankton and bacteria (TL = 1). In exploited pelagic ecosystems, fisheries that target large piscivorous fishes act as the ecosystem s apex predators. Over time, fishing can cause the overall size composition of the catch to decline, and, in general, the TLs of smaller organisms are lower than those of larger organisms. The mean TL of the organisms taken by a fishery is a potentially useful metric of ecosystem change and sustainability because it integrates an array of biological information about the components of the system. There has been increasing attention to analyzing the mean TL of fisheries catches and discards since a study demonstrated that, according to FAO landings statistics, the mean TL of the fishes and invertebrates landed globally had declined from 1950 to Some ecosystems, however, have changed in the other direction, from lower to higher TL communities. Given the potential utility of this approach, TLs were estimated for a time series of annual catches and discards from 1993 to 2003 for three purse-seine fishing modes and the pole-and-line fishery in the EPO. The estimates were made by applying the TLs from the EPO ecosystem model (see Section 7), weighted by the catch data by fishery and year for all model groups from the IATTC tuna, bycatch, and discard data bases. The TLs of the summed catches of all purse-seine and pole-and-line fisheries were fairly constant from year to year (Figure J-2: Average PS+LP). The TL of the floating-object sets varied more than those of the other fisheries, due to the interannual variability in the sizes of the tunas caught and the species compositions of the bycatches in those sets. The TLs were also estimated separately for the time series of retained and discarded catches by year for the purse-seine fishery from 1993 to 2003 (Figure J-3). The TLs of the retained catches were quite stable from year to year, while the TLs of the discarded catches varied considerably. The greatest variation occurred for sets on unassociated fish. The low TL of the discarded catches by sets on unassociated fish in 1998 was due to increased bycatches of rays, which feed on plankton and other small animals that occupy low TLs. From 1998 to 2001, the discarded catches of rays gradually declined and those of large sharks increased, resulting in a gradually increasing TL of the discarded catches over that interval. To a lesser degree, the average TLs of the discarded catches of sets on floating objects also increased from 1998 to That increase was due primarily to increasing bycatches of large wahoo and small dorado. 7. ECOSYSTEM MODELING It is clear that the different components of an ecosystem interact. The best way to describe the relationships and explore their effects is through ecosystem modeling. Our understanding of this complex maze of connections is at an early stage, and, consequently, the current ecosystem models are most useful as descriptive devices for exploring the effects of a mix of hypotheses and established connections among the ecosystem components. Ecosystem models must be compromises between simplistic representations on the one hand and unmanageable complexity on the other. The IATTC staff has developed a model of the pelagic ecosystem in the tropical EPO (IATTC Bulletin, Vol. 22, No. 3) to explore how fishing and climate variation might affect the animals at middle and upper trophic levels. The ecosystem model has 38 components, including the principal exploited species (e.g. tunas), functional groups (e.g. sharks and flyingfishes), and sensitive species (e.g. sea turtles). Some taxa are further separated into size categories (e.g. large and small marlins). The model has finer taxonomic resolution at the upper trophic levels, but most of the system s biomass is contained in the middle and lower trophic levels. Fisheries landings and discards were estimated for five fishing gears : pole-and-line, longline, and purse-seine sets on tunas associated with dolphins, with floating objects, and in unassociated schools. The model focuses on the pelagic regions; localized, coastal ecosystems are not adequately described by the model. Most of the information describing inter-specific interactions in the model comes from a joint IATTC-NMFS project, which included studies of the food habits of co-occurring yellowfin, skipjack, and bigeye tuna, dolphins, pelagic sharks, billfishes, dorado, wahoo, rainbow runner, and others. The impetus of the project was to contribute to the understanding of the tuna-dolphin association, and a communitylevel sampling design was adopted. The ecosystem model has been used to evaluate the possible effects of variability in bottom-up forcing by the environment on the middle and upper trophic levels of the pelagic ecosystem. Predetermined time series of producer biomasses were put into the model as proxies for changes in primary production that have been documented during El Niño and La Niña events, and the dynamics of the remaining components of the ecosystem were simulated. The model was also used to evaluate the relative contributions of fishing and the environment in shaping ecosystem structure in the tropical pelagic EPO. This was done by using the model to predict which components of the ecosystem might be susceptible to top-down effects of fishing, given the apparent importance of environmental variability in structuring the ecosystem. In general, animals with relatively low turnover rates were influenced more by fishing than by the environment, and animals with relatively high turnover rates more by the environment than by fishing.
109 8. ACTIONS BY THE IATTC AND THE AIDCP ADDRESSING ECOSYSTEM CONSIDERATIONS Both the IATTC and the Agreement on the International Dolphin Conservation Program (AIDCP) have objectives that address the incorporation of ecosystem considerations into the management of the tuna fisheries in the EPO. Actions taken in the past include: 8.1. Dolphins a. For many years, the impact of the fishery on the dolphin populations has been assessed, and programs to reduce or eliminate that impact have met with considerable success. b. The incidental mortality of each stock of dolphins has been limited to levels that are insignificant relative to stock sizes Sea turtles a. A data base on all sea turtle sightings, captures, and mortalities reported by observers has been compiled. b. In June 2003 the IATTC adopted a Recommendation on Sea Turtles, which contemplates the development of a three-year program that could include mitigation of sea turtle bycatch, biological research on sea turtles, improvement of fishing gears, industry education and other techniques to improve sea turtle conservation. In January 2004, the Working Group on Bycatch drew up a detailed program that includes all these elements, and urges all nations with vessels fishing for tunas in the EPO to provide the IATTC with information on interactions with sea turtles in the EPO, including both incidental and direct catches and other impacts on sea turtle populations. Resolution C on a three-year program to mitigate the impact of tuna fishing on sea turtles was adopted by the IATTC in June 2004; it includes requirements for data collection, mitigation measures, industry education, capacity building and reporting. c. IATTC Resolution C-04-05, contains provisions on releasing and handling of sea turtles captured in purse seines. The resolution also prohibits vessels from disposing of plastic containers and other debris at sea, and instructs the Director to study and formulate recommendations regarding the design of FADs, particularly the use of netting attached underwater to FADs. d. In response to a request made by the Subsecretaría de Recursos Pesqueros of Ecuador, the IATTC began a program, supported by the World Wildlife Fund and the United States government, to mitigate the incidental capture of sea turtles, to reduce the mortality of sea turtles due to longline fishing, and to compare the catch rates of tunas, billfishes, and dorado using circle and J hooks of two sizes. Circle hooks do not hook as many turtles as the J hooks currently used in the longline fishery, and the chance of serious injury to the sea turtles that bite the hooks is reduced because they are wider and they tend to hook the lower jaw, rather than the more dangerous deep hookings in the esophagus and other areas, which are more common with the J hooks. Improved procedures and instruments to release hooked and entangled sea turtles have also been disseminated to the longline fleets of the region. In 2004, observers recorded data on more than 60 fishing trips of the vessels that are testing the different hooks. In addition, workshops and presentations were conducted by IATTC staff members and others in Colombia, Costa Rica, Ecuador, El Salvador, Guatemala, Mexico, Panama, and Peru Other species a. In June 2000, the IATTC adopted a resolution on live release of sharks, rays, billfishes, dorado, and other non-target species. b. IATTC Resolution C instructs the Director to seek funds for reduction of incidental mortality of juvenile tunas, for developing techniques and equipment to facilitate release of billfishes, sharks, and rays from the deck or the net, and to carry out experiments to estimate the survival rates of released billfishes, sharks, and rays All species a. Data on the bycatches of large purse-seine vessels are being collected, and governments are urged to provide bycatch information for other vessels. b. Data on the spatial distributions of the bycatches and the bycatch/catch ratios have been collected for analyses of policy options to reduce bycatches. c. Information to evaluate measures to reduce the bycatches, such as closures, effort limits, etc., has been collected. d. Assessments of habitat preferences and the effect of environmental changes have been made. 9. FUTURE DEVELOPMENTS It is unlikely, in the near future at least, that there will be stock assessments for most of the bycatch species. In lieu of formal assessments, it may be possible to develop indices to assess trends in the status of these species. The IATTC staff s experience with dolphins suggests 107

110 108 that the task is not trivial if relatively high precision is required. An array of measures has been proposed to study changes in ecosystem properties. This could include studies of average trophic level, size spectra, dominance, diversity, etc., to describe the ecosystem in an aggregate way. The distributions of the fisheries for tunas and billfishes in the EPO are such that several regions with different ecological characteristics may be included. Within them, water masses, oceanographic or topographic features, influences from the continent, etc., may generate heterogeneity that affects the distributions of the different species and their relative abundances in the catches. It would be desirable to increase our understanding of these ecological strata so that they can be used in our analyses. It is important to continue studies of the ecosystems in the EPO. The power to resolve issues related to fisheries and the ecosystem will increase with the number of habitat variables, taxa and trophic levels studied and with longer time series of data. FIGURE J-1. Simplified food-web diagram of the pelagic ecosystem in the tropical eastern Pacific Ocean. The numbers inside the boxes indicate the approximate trophic levels of each group. FIGURA J-1. Diagrama simplificado de la red trófica del ecosistema pelágico en el Océano Pacífico oriental tropical. Los números en los recuadros indican el nivel trófico aproximado de cada grupo.
THE FISHERY FOR TUNAS AND BILLFISHES IN THE EASTERN PACIFIC OCEAN IN 2008
 INTER-AMERICAN TROPICAL TUNA COMMISSION 10 TH STOCK ASSESSMENT REVIEW MEETING La Jolla, California (USA) 12-15 May 2009 DOCUMENT SARM-10-04 THE FISHERY FOR TUNAS AND BILLFISHES IN THE EASTERN PACIFIC OCEAN
COVER PHOTOGRAPH BY WAYNE PERRYMAN FOTOGRAFÍA EN LA PORTADA POR WAYNE PERRYMAN
 COVER PHOTOGRAPH BY WAYNE PERRYMAN FOTOGRAFÍA EN LA PORTADA POR WAYNE PERRYMAN INTER-AMERICAN TROPICAL TUNA COMMISSION COMISIÓN INTERAMERICANA DEL ATÚN TROPICAL Fishery Status Report Informe de la Situación
DOCUMENT SARM-9-04 THE FISHERY FOR TUNAS AND BILLFISHES IN THE EASTERN PACIFIC OCEAN IN 2007
 INTER-AMERICAN TROPICAL TUNA COMMISSION 9 TH STOCK ASSESSMENT REVIEW MEETING LA JOLLA, CALIFORNIA (USA) 12-16 MAY 28 OCUMENT SARM-9-4 THE FISHERY FOR TUNAS AN BILLFISHES IN THE EASTERN PACIFIC OCEAN IN
COVER PHOTOGRAPH BY WAYNE PERRYMAN FOTOGRAFÍA EN LA PORTADA POR WAYNE PERRYMAN
 COVER PHOTOGRAPH BY WAYNE PERRYMAN FOTOGRAFÍA EN LA PORTADA POR WAYNE PERRYMAN INTER-AMERICAN TROPICAL TUNA COMMISSION COMISIÓN INTERAMERICANA DEL ATÚN TROPICAL Fishery Status Report Informe de la Situación
NINTH MEETING DOCUMENT SAC-09-03
 INTER-AMERICAN TROPICAL TUNA COMMISSION SCIENTIFIC ADVISORY COMMITTEE NINTH MEETING La Jolla, California (USA) 14-18 May 2018 DOCUMENT SAC-09-03 THE FISHERY FOR TUNAS AND BILLFISHES IN THE EASTERN PACIFIC
COVER PHOTOGRAPH BY WAYNE PERRYMAN FOTOGRAFÍA EN LA PORTADA POR WAYNE PERRYMAN
 COVER PHOTOGRAPH BY WAYNE PERRYMAN FOTOGRAFÍA EN LA PORTADA POR WAYNE PERRYMAN INTER-AMERICAN TROPICAL TUNA COMMISSION COMISIÓN INTERAMERICANA DEL ATÚN TROPICAL Fishery Status Report Informe de la Situación
TUNAS, BILLFISHES AND OTHER PELAGIC SPECIES IN THE EASTERN PACIFIC OCEAN IN 2016
 TUNAS, BILLFISHES AND OTHER PELAGIC SPECIES IN THE EASTERN PACIFIC OCEAN IN 2016 A. The fishery for tunas and billfishes in the eastern Pacific Ocean... 3 B. Yellowfin tuna... 65 C. Skipjack tuna... 76
COVER PHOTOGRAPH BY WAYNE PERRYMAN FOTOGRAFÍA EN LA PORTADA POR WAYNE PERRYMAN
 COVER PHOTOGRAPH BY WAYNE PERRYMAN FOTOGRAFÍA EN LA PORTAA POR WAYNE PERRYMAN INTER-AMERICAN TROPICAL TUNA COMMISSION COMISIÓN INTERAMERICANA EL ATÚN TROPICAL Fishery Status Report Informe de la Situación
COVER PHOTOGRAPH BY WAYNE PERRYMAN FOTOGRAFÍA EN LA PORTADA POR WAYNE PERRYMAN
 COVER PHOTOGRAPH BY WAYNE PERRYMAN FOTOGRAFÍA EN LA PORTADA POR WAYNE PERRYMAN INTER-AMERICAN TROPICAL TUNA COMMISSION COMISIÓN INTERAMERICANA DEL ATÚN TROPICAL Fishery Status Report Informe de la Situación
COVER PHOTOGRAPH BY WAYNE PERRYMAN FOTOGRAFÍA EN LA PORTADA POR WAYNE PERRYMAN
 COVER PHOTOGRAPH BY WAYNE PERRYMAN FOTOGRAFÍA EN LA PORTADA POR WAYNE PERRYMAN INTER-AMERICAN TROPICAL TUNA COMMISSION COMISIÓN INTERAMERICANA DEL ATÚN TROPICAL Fishery Status Report Informe de la Situación
COVER PHOTOGRAPH BY WAYNE PERRYMAN FOTOGRAFÍA EN LA PORTADA POR WAYNE PERRYMAN
 COVER PHOTOGRAPH BY WAYNE PERRYMAN FOTOGRAFÍA EN LA PORTADA POR WAYNE PERRYMAN INTER-AMERICAN TROPICAL TUNA COMMISSION COMISIÓN INTERAMERICANA DEL ATÚN TROPICAL Fishery Status Report Informe de la Situación
COVER PHOTOGRAPH BY WAYNE PERRYMAN FOTOGRAFÍA EN LA PORTADA POR WAYNE PERRYMAN
 COVER PHOTOGRAPH BY WAYNE PERRYMAN FOTOGRAFÍA EN LA PORTADA POR WAYNE PERRYMAN INTER-AMERICAN TROPICAL TUNA COMMISSION COMISIÓN INTERAMERICANA DEL ATÚN TROPICAL Fishery Status Report Informe de la Situación
COVER PHOTOGRAPH BY WAYNE PERRYMAN FOTOGRAFÍA EN LA PORTADA POR WAYNE PERRYMAN
 COVER PHOTOGRAPH BY WAYNE PERRYMAN FOTOGRAFÍA EN LA PORTADA POR WAYNE PERRYMAN INTER-AMERICAN TROPICAL TUNA COMMISSION COMISIÓN INTERAMERICANA DEL ATÚN TROPICAL Fishery Status Report Informe de la Situación
COVER PHOTOGRAPH BY WAYNE PERRYMAN FOTOGRAFÍA EN LA PORTADA POR WAYNE PERRYMAN
 COVER PHOTOGRAPH BY WAYNE PERRYMAN FOTOGRAFÍA EN LA PORTADA POR WAYNE PERRYMAN INTER-AMERICAN TROPICAL TUNA COMMISSION COMISIÓN INTERAMERICANA DEL ATÚN TROPICAL Fishery Status Report Informe de la Situación
COVER PHOTOGRAPH BY WAYNE PERRYMAN FOTOGRAFÍA EN LA PORTADA POR WAYNE PERRYMAN
 COVER PHOTOGRAPH BY WAYNE PERRYMAN FOTOGRAFÍA EN LA PORTADA POR WAYNE PERRYMAN INTER-AMERICAN TROPICAL TUNA COMMISSION COMISIÓN INTERAMERICANA DEL ATÚN TROPICAL Fishery Status Report Informe de la Situación
72ª REUNIÓN DOCUMENTO IATTC ATUNES Y PECES PICUDOS EN EL OCÉANO PACÍFICO ORIENTAL EN 2003
 COMISIÓN INTERAMERICANA DEL ATÚN TROPICAL INTER-AMERICAN TROPICAL TUNA COMMISSION 72ª REUNIÓN LIMA (PERÚ) 14-18 DE JUNIO DE 2004 DOCUMENTO IATTC-72-04 ATUNES Y PECES PICUDOS EN EL OCÉANO PACÍFICO ORIENTAL
74ª REUNIÓN DOCUMENTO IATTC LOS ATUNES Y PECES PICUDOS EN EL OCÉANO PACÍFICO ORIENTAL EN 2005
 COMISIÓN INTERAMERICANA DEL ATÚN TROPICAL INTER-AMERICAN TROPICAL TUNA COMISSION 74ª REUNIÓN BUSAN (COREA) 26-30 DE JUNIO DE 2006 DOCUMENTO IATTC-74-04 LOS ATUNES Y PECES PICUDOS EN EL OCÉANO PACÍFICO
80ª REUNIÓN DOCUMENTO IATTC LOS ATUNES Y PECES PICUDOS EN EL OCÉANO PACÍFICO ORIENTAL EN 2008
 COMISIÓN INTERAMERICANA DEL ATÚN TROPICAL 80ª REUNIÓN LA JOLLA, CALIFORNIA (EE.UU.) 8-12 DE JUNIO DE 2009 DOCUMENTO IATTC-80-05 LOS ATUNES Y PECES PICUDOS EN EL OCÉANO PACÍFICO ORIENTAL EN 2008 A. La pesquería
81ª REUNIÓN DOCUMENTO IATTC LOS ATUNES Y PECES PICUDOS EN EL OCÉANO PACÍFICO ORIENTAL EN 2009
 COMISIÓN INTERAMERICANA DEL ATÚN TROPICAL 81ª REUNIÓN ANTIGUA (GUATEMALA) 27 DE SEPTIEMBRE 1 DE OCTUBRE DE 2010 DOCUMENTO IATTC-81-05 LOS ATUNES Y PECES PICUDOS EN EL OCÉANO PACÍFICO ORIENTAL EN 2009 A.
70ª REUNION DOCUMENTO CIAT ATUNES Y PECES PICUDOS EN EL OCEANO PACIFICO ORIENTAL
 INTER-AMERICAN TROPICAL TUNA COMMISSION COMISIÓN INTERAMERICANA DEL ATÚN TROPICAL 70ª REUNION ANTIGUA (GUATEMALA) 24-27 DE JUNIO DE 2003 DOCUMENTO CIAT -70-04 ATUNES Y PECES PICUDOS EN EL OCEANO PACIFICO
Fishery Status Report No 3: Tunas and Billfishes in the Eastern Pacific Ocean in 2004 1 IATTC*
 ISC/06/PLENARY/09 6 th Meeting of the ISC 23-27 March, 2006 La Jolla, California, U.S.A. Fishery Status Report No 3: Tunas and Billfishes in the Eastern Pacific Ocean in 2004 1 IATTC* March 2006 *The full
COVER PHOTOGRAPH BY WAYNE PERRYMAN FOTOGRAFÍA EN LA PORTADA POR WAYNE PERRYMAN
 OVER PHOTOGRAPH BY WAYNE PERRYMAN FOTOGRAFÍA EN LA PORTADA POR WAYNE PERRYMAN INTERAMERIAN TROPIAL TUNA OMMISSION OMISIÓN INTERAMERIANA DEL ATÚN TROPIAL Fishery Status Report Informe de la Situación de
74ª REUNIÓN DOCUMENTO IATTC LOS ATUNES Y PECES PICUDOS EN EL OCÉANO PACÍFICO ORIENTAL EN 2006
 COMISIÓN INTERAMERICANA DEL ATÚN TROPICAL INTER-AMERICAN TROPICAL TUNA COMISSION 74ª REUNIÓN BUSAN (COREA) 26-30 DE JUNIO DE 2006 DOCUMENTO IATTC-75-06 LOS ATUNES Y PECES PICUDOS EN EL OCÉANO PACÍFICO
DOCUMENTO SAC LA PESQUERÍA DE ATUNES Y PECES PICUDOS EN EL OCÉANO PACÍFICO ORIENTAL
 COMISIÓN INTERAMERICANA DEL ATÚN TROPICAL COMITÉ CIENTÍFICO ASESOR QUINTA REUNIÓN La Jolla, California (EE.UU.) 12-16 de mayo de 2014 DOCUMENTO SAC-05-06 LA PESQUERÍA DE ATUNES Y PECES PICUDOS EN EL OCÉANO
LA PESQUERÍA DE ATUNES Y PECES PICUDOS EN EL OCÉANO PACÍFICO ORIENTAL EN 2009
 COMISIÓN INTERAMERICANA DEL ATÚN TROPICAL COMITÉ CIENTÍFICO ASESOR PRIMERA REUNIÓN La Jolla, California (EE.UU.) 31 de agosto - 3 de septiembre de 2010 DOCUMENTO SAC-01-05 LA PESQUERÍA DE ATUNES Y PECES
COMISIÓN INTERAMERICANA DEL ATÚN TROPICAL 87ª REUNIÓN LOS ATUNES Y PECES PICUDOS EN EL OCÉANO PACÍFICO ORIENTAL EN 2013
 COMISIÓN INTERAMERICANA DEL ATÚN TROPICAL 87ª REUNIÓN Lima (Perú) 14-18 de julio de 2014 DOCUMENTO IATTC-87-03ª (REVISADO) LOS ATUNES Y PECES PICUDOS EN EL OCÉANO PACÍFICO ORIENTAL EN 2013 A. La pesquería
82ª REUNIÓN DOCUMENTO IATTC LOS ATUNES Y PECES PICUDOS EN EL OCÉANO PACÍFICO ORIENTAL EN 2010
 COMISIÓN INTERAMERICANA DEL ATÚN TROPICAL 82ª REUNIÓN LA JOLLA, CALIFORNIA (EE.UU.) 4-8 DE JULIO DE 2011 DOCUMENTO IATTC-82-05 LOS ATUNES Y PECES PICUDOS EN EL OCÉANO PACÍFICO ORIENTAL EN 2010 A. La pesquería
COMISIÓN INTERAMERICANA DEL ATÚN TROPICAL COMITÉ CIENTÍFICO ASESOR NOVENA REUNIÓN. La Jolla, California (EE.UU.) de mayo de 2018
 de mayo de 2018") COMISIÓN INTERAMERICANA DEL ATÚN TROPICAL COMITÉ CIENTÍFICO ASESOR NOVENA REUNIÓN La Jolla, California (EE.UU.) 14-18 de mayo de 2018 DOCUMENTO SAC-09-03 LA PESQUERÍA DE ATUNES Y PECES PICUDOS EN EL OCÉANO
COMISIÓN INTERAMERICANA DEL ATÚN TROPICAL COMITÉ CIENTÍFICO ASESOR NOVENA REUNIÓN La Jolla, California (EE.UU.) 14-18 de mayo de 2018 DOCUMENTO SAC-09-03 LA PESQUERÍA DE ATUNES Y PECES PICUDOS EN EL OCÉANO
COMISIÓN INTERAMERICANA DEL ATÚN TROPICAL 93ª REUNIÓN DOCUMENTO IATTC-93-01
 COMISIÓN INTERAMERICANA DEL ATÚN TROPICAL 93ª REUNIÓN San Diego, California (EE.UU.) 24 y 27-30 de agosto de 2018 DOCUMENTO IATTC-93-01 LOS ATUNES, PECES PICUDOS, Y OTRAS ESPECIES PELÁGICAS EN EL OCÉANO
DOCUMENTO SAC LA PESQUERÍA DE ATUNES Y PECES PICUDOS EN EL OCÉANO PACÍFICO ORIENTAL EN 2014
 COMISIÓN INTERAMERICANA DEL ATÚN TROPICAL COMITÉ CIENTÍFICO ASESOR SEXTA REUNIÓN La Jolla, California (EE.UU.) 11-15 de mayo de 2015 DOCUMENTO SAC-06-03 LA PESQUERÍA DE ATUNES Y PECES PICUDOS EN EL OCÉANO
DOCUMENTO SAC-08-03a
 COMISIÓN INTERAMERICANA DEL ATÚN TROPICAL COMITÉ CIENTÍFICO ASESOR OCTAVA REUNIÓN La Jolla, California (EE.UU.) 8-12 de mayo de 2017 DOCUMENTO SAC-08-03a LA PESQUERÍA DE ATUNES Y PECES PICUDOS EN EL OCÉANO
COMISIÓN INTERAMERICANA DEL ATÚN TROPICAL 90ª REUNIÓN. DOCUMENTO IATTC-90-04a
 COMISIÓN INTERAMERICANA DEL ATÚN TROPICAL 90ª REUNIÓN La Jolla, California (USA) 27 de junio-1 de julio de 2016 DOCUMENTO IATTC-90-04a LOS ATUNES, PECES PICUDOS, Y OTROS PECES PELÁGICOS EN EL OCÉANO PACÍFICO
Condición de las poblaciones de atunes, 2017 Status of the tuna stocks, 2017
 Condición de las poblaciones de atunes, 2017 Status of the tuna stocks, 2017 93 a Reunión de la CIAT 93 rd Meeting of the IATTC 24, 27-30 Agosto-August 2018 - San Diego, California, EEUU USA Temario Outline
ANNUAL REPORT of the Inter-American Tropical Tuna Commission
 ISSN: 0074-1000 ANNUAL REPORT of the Inter-American Tropical Tuna Commission 2010 INFORME ANUAL de la Comisión Interamericana del Atún Tropical La Jolla, California 2015 COMMISSIONERS COMISIONADOS BELIZE
INTER-AMERICAN TROPICAL TUNA COMMISSION COMISION INTERAMERICANA DEL ATUN TROPICAL
 INTER-AMERICAN TROPICAL TUNA COMMISSION COMISION INTERAMERICANA DEL ATUN TROPICAL 68ª REUNION SAN SALVADOR (EL SALVADOR) 19-21 DE JUNIO DE 2001 DOCUMENTO A1 LA PESQUERIA DE ATUNES Y ESPECIES AFINES EN
ANNUAL REPORT of the Inter-American Tropical Tuna Commission
 ISSN: 0074-1000 ANNUAL REPORT of the Inter-American Tropical Tuna Commission 2010 INFORME ANUAL de la Comisión Interamericana del Atún Tropical La Jolla, California 2015 COMMISSIONERS COMISIONADOS BELIZE
ANNUAL REPORT of the Inter-American Tropical Tuna Commission
 ISSN: 0074-1000 ANNUAL REPORT of the Inter-American Tropical Tuna Commission 2002 INFORME ANUAL de la Comisión Interamericana del Atún Tropical La Jolla, California 2004 The Inter-American Tropical Tuna
ANNUAL REPORT of the Inter-American Tropical Tuna Commission
 ISSN: 0074-1000 ANNUAL REPORT of the Inter-American Tropical Tuna Commission 2001 INFORME ANUAL de la Comisión Interamericana del Atún Tropical La Jolla, California 2002 The Inter-American Tropical Tuna
PROPUESTAS DE INVESTIGACIÓN RESEARCH PROPOSALS. 92 a Reunión de la CIAT
 PROPUESTAS DE INVESTIGACIÓN RESEARCH PROPOSALS 92 a Reunión de la CIAT 92 nd Meeting of the IATTC MOTIVACIÓN MOTIVATION No incluidas en el plan de trabajo actual Requieren colaboración con científicos
FIGURE 1. Average quarterly fishing mortality at age of bigeye tuna, by all gears, in the EPO. The curves for and display the
 FIGURE 1. Average quarterly fishing mortality at age of bigeye tuna, by all gears, in the EPO. The curves for 1975-1992 and 1993-2010 display the averages for the periods before and after the expansion
STATUS OF BIGEYE TUNA IN THE EASTERN PACIFIC OCEAN IN 2010 AND OUTLOOK FOR THE FUTURE
 STATUS OF BIGEYE TUNA IN THE EASTERN PACIFIC OCEAN IN 2010 AND OUTLOOK FOR THE FUTURE Alexandre Aires-da-Silva and Mark N. Maunder This report presents the most current stock assessment of bigeye tuna
Regional Gross Domestic Product series Income accounts of the household sector series
 22 December 2017 Spanish Regional Accounts. Base 2010 Regional Gross Domestic Product. 2010-2016 series Income accounts of the household sector. 2010-2015 series Main results - Illes Balears was the Autonomous
Actividades actuales y planeadas del personal de la CIAT Current and planned activities of the IATTC staff
 Comisión Interamericana del Atún Tropical Inter-American Tropical Tuna Commission Actividades actuales y planeadas del personal de la CIAT Current and planned activities of the IATTC staff 82 a Reunión
DOCUMENTO SAC-07-07f(ii)
") COMISIÓN INTERAMERICANA DEL ATÚN TROPICAL COMITÉ CIENTÍFICO ASESOR SÉPTIMA REUNIÓN La Jolla, California (EE.UU.) 09-13 de mayo de 2016 DOCUMENTO SAC-07-07f(ii) EVALUACIÓN DE LA DISMINUCIÓN DE LA CAPTURA
COMISIÓN INTERAMERICANA DEL ATÚN TROPICAL COMITÉ CIENTÍFICO ASESOR SÉPTIMA REUNIÓN La Jolla, California (EE.UU.) 09-13 de mayo de 2016 DOCUMENTO SAC-07-07f(ii) EVALUACIÓN DE LA DISMINUCIÓN DE LA CAPTURA
COMISIÓN INTERAMERICANA DEL ATÚN TROPICAL COMITÉ CIENTÍFICO ASESOR SEXTA REUNIÓN. La Jolla, California (EE.UU.) de mayo de 2015
 de mayo de 2015") COMISIÓN INTERAMERICANA DEL ATÚN TROPICAL COMITÉ CIENTÍFICO ASESOR SEXTA REUNIÓN La Jolla, California (EE.UU.) 11-15 de mayo de 2015 DOCUMENTO SAC-06-06 CONDICIÓN DEL ATÚN ALETA AMARILLA EN EL OCÉANO PACÍFICO
COMISIÓN INTERAMERICANA DEL ATÚN TROPICAL COMITÉ CIENTÍFICO ASESOR SEXTA REUNIÓN La Jolla, California (EE.UU.) 11-15 de mayo de 2015 DOCUMENTO SAC-06-06 CONDICIÓN DEL ATÚN ALETA AMARILLA EN EL OCÉANO PACÍFICO
INTER-AMERICAN TROPICAL TUNA COMMISSION SCIENTIFIC ADVISORY COMMITTEE EIGHTH MEETING. La Jolla, California (USA) 8-12 May DOCUMENT SAC-08-04b
 8-12 May DOCUMENT SAC-08-04b") INTER-AMERICAN TROPICAL TUNA COMMISSION SCIENTIFIC ADVISORY COMMITTEE EIGHTH MEETING La Jolla, California (USA) 8-12 May 2017 DOCUMENT SAC-08-04b STATUS OF YELLOWFIN TUNA IN THE EASTERN PACIFIC OCEAN IN
INTER-AMERICAN TROPICAL TUNA COMMISSION SCIENTIFIC ADVISORY COMMITTEE EIGHTH MEETING La Jolla, California (USA) 8-12 May 2017 DOCUMENT SAC-08-04b STATUS OF YELLOWFIN TUNA IN THE EASTERN PACIFIC OCEAN IN
The annual variation rate of the Housing Price Index decreases one percentage point, standing at 6.2%
 07 June 2018 Housing Price Index (HPI). Base 2015 First quarter 2018 The annual variation rate of the Housing Price Index decreases one percentage point, standing at 6.2% Housing prices rise 1.4 points
Ada County Existing/Resale
 Ada County Existing/Resale October 2018 ket Statistics Report provided by Boise Regional REALTORS Data from the Intermountain MLS as of ember 11, 2018 Key Metrics Oct 2017 Oct 2018 % Chg YTD 2017 YTD 2018
Spanish Regional Accounts. Base Regional Gross Domestic Product series Income accounts of the household sector.
 23 December 2015 Spanish Regional Accounts. Base 2010 Regional Gross Domestic Product. 2010-2014 series Income accounts of the household sector. 2010-2013 series Main results - La Rioja, Comunitat Valenciana
Instituto Nacional de Pesca Biblioteca Dra. Lucía Solórzano Constantine
 LAS PESQUERIAS ARTESANALES DE LA COSTA DEL ECUADOR Y SUS CAPTURAS EN EL AÑO 1982 THE COASTAL ARTISANAL FISHERIES OF ECUADOR AND THEIR CATCHES IN 1982 D.M. Herdson, W.T. Rodríguez, J. Martínez. Resumen.-
Canyon County Existing/Resale
 Canyon County Existing/Resale October 2018 ket Statistics Data from the Intermountain MLS as of ember 11, 2018 Key Metrics Oct 2017 Oct 2018 % Chg YTD 2017 YTD 2018 % Chg Closed Sales 331 349 5.4% 3,134
Ada County Existing/Resale
 Ada County Existing/Resale tember 2018 ket Statistics Report provided by Boise Regional REALTORS Key Metrics 2017 2018 % Chg YTD 2017 YTD 2018 % Chg Closed Sales 811 616-24.0% 6,301 6,136-2.6% Median Sales
Canyon County Existing/Resale
 Canyon County Existing/Resale tember 2018 ket Statistics Key Metrics 2017 2018 % Chg YTD 2017 YTD 2018 % Chg Closed Sales 366 301 17.8% 2,803 2,953 5.4% Median Sales Price $176,000 $210, 19.6% $170,000
CAF 05 05b Fondo especial para fomentar la capacidad institucional CAF 05 05b Special Fund for promoting institutional capacity building
 CAF 05 05b Fondo especial para fomentar la capacidad institucional CAF 05 05b Special Fund for promoting institutional capacity building 92 a Reuniones Anuales de la CIAT y el APICD 92 nd Meeting of the
Instituto Nacional de Pesca Biblioteca Dra. Lucía Solórzano Constantine
 LA PESQUERIA DE PECES PELÁGICOS PEQUEÑOS DURANTE 1999 THE SMALL PELAGIC FISHERY DURING 1999. Luis Gamboa M. Resumen.- Se presenta información sobre los desembarques totales durante 1999, siendo éstos de
INTER-AMERICAN TROPICAL TUNA COMMISSION COMISION INTERAMERICANA DEL ATUN TROPICAL
 ISSN: 0074-0993 INTER-AMERICAN TROPICAL TUNA COMMISSION COMISION INTERAMERICANA DEL ATUN TROPICAL Bulletin Boletín Vol. 21, No. 6 A REVIEW OF THE JAPANESE LONGLINE FISHERY FOR TUNAS AND BILLFISHES IN THE
DOCUMENTO SAC-08-04b
 COMISIÓN INTERAMERICANA DEL ATÚN TROPICAL COMITÉ CIENTÍFICO ASESOR OCTAVA REUNIÓN La Jolla, California (EE.UU.) 8-12 de mayo de 2017 DOCUMENTO SAC-08-04b CONDICIÓN DEL ATÚN ALETA AMARILLA EN EL OCÉANO
90ª REUNIÓN (REANUDADA) DOCUMENTO IATTC-90 INF-B MEDIDAS ALTERNATIVAS DE ORDENACIÓN PARA LOS ATUNES TROPICALES EN EL OPO
 DOCUMENTO IATTC-90 INF-B MEDIDAS ALTERNATIVAS DE ORDENACIÓN PARA LOS ATUNES TROPICALES EN EL OPO") COMISIÓN INTERAMERICANA DEL ATÚN TROPICAL 90ª REUNIÓN (REANUDADA) La Jolla, California (EE.UU.) 12-14 de octubre de 2016 DOCUMENTO IATTC-90 INF-B MEDIDAS ALTERNATIVAS DE ORDENACIÓN PARA LOS ATUNES TROPICALES
COMISIÓN INTERAMERICANA DEL ATÚN TROPICAL 90ª REUNIÓN (REANUDADA) La Jolla, California (EE.UU.) 12-14 de octubre de 2016 DOCUMENTO IATTC-90 INF-B MEDIDAS ALTERNATIVAS DE ORDENACIÓN PARA LOS ATUNES TROPICALES
LA PESCA DE ATÚN EN EL OCÉANO PACÍFICO ORIENTAL
 Comisión Interamericana del Atún Tropical LA PESCA DE ATÚN EN EL OCÉANO PACÍFICO ORIENTAL con énfasis en la flota industrial de México Dra. Carolina Minte-Vera Programa de Evaluación de Poblaciones cminte@iattc.org
LAS PESQUERIAS DE ATUN ALETA AZUL DEL PACIFICO, ATUN ALBACORA, PEZ ESPADA, Y MARLIN AZUL EN EL OCEANO PACIFICO, Y EVALUACIONES DE ESTAS ESPECIES ATUN
 LAS PESQUERIAS DE ATUN ALETA AZUL DEL PACIFICO, ATUN ALBACORA, PEZ ESPADA, Y MARLIN AZUL EN EL OCEANO PACIFICO, Y EVALUACIONES DE ESTAS ESPECIES ATUN ALETA AZUL DEL PACIFICO La mayoría de las capturas
COMISIÓN INTERAMERICANA DEL ATÚN TROPICAL COMITÉ CIENTÍFICO ASESOR NOVENA REUNIÓN. La Jolla, California (EE.UU.) de mayo de 2018
 de mayo de 2018") COMISIÓN INTERAMERICANA DEL ATÚN TROPICAL COMITÉ CIENTÍFICO ASESOR NOVENA REUNIÓN La Jolla, California (EE.UU.) 14-18 de mayo de 2018 DOCUMENTO SAC-09-06 CONDICIÓN DEL ATÚN ALETA AMARILLA EN EL OCÉANO
COMISIÓN INTERAMERICANA DEL ATÚN TROPICAL COMITÉ CIENTÍFICO ASESOR NOVENA REUNIÓN La Jolla, California (EE.UU.) 14-18 de mayo de 2018 DOCUMENTO SAC-09-06 CONDICIÓN DEL ATÚN ALETA AMARILLA EN EL OCÉANO
STATUS OF YELLOWFIN TUNA IN THE EASTERN PACIFIC OCEAN IN 2009 AND OUTLOOK FOR THE FUTURE
 STATUS OF YELLOWFIN TUNA IN THE EASTERN PACIFIC OCEAN IN 2009 AND OUTLOOK FOR THE FUTURE Mark N. Maunder and Alexandre Aires-da-Silva This report presents the most current stock assessment of yellowfin
In December, the number of property transfers registered is 124,616 properties, that is, 9.2% more than in the same month of 2013
 10 February 2015 Statistics on Transfer of Property Rights (STPR) December 2014 and Year 2014. Provisional data In December, the number of property transfers registered is 124,616 properties, that is,
THE IATTC PROGRAM FOR IN-PORT SAMPLING OF TUNA CATCHES
 THE IATTC PROGRAM FOR IN-PORT SAMPLING OF TUNA CATCHES 1. Introduction... 255 2. Details of the sampling program... 255 3. Sampling statistics for 2009... 257 Figure... 258 References... 257 1. INTRODUCTION
Area Females Males (F+M+Unk) Hooks PAC PAC PAC PAC PAC
 Hooks PAC PAC PAC PAC PAC") INSTITUTO ESPAÑOL DE OCEANOGRAFÍA Department of tuna and tuna-like species (Large Pelagic Fish) Contribution to the 2nd Technical meeting on Sharks of the IATTC, 14-1313 May, La Jolla California, USA BIOLOGICAL
INSTITUTO ESPAÑOL DE OCEANOGRAFÍA Department of tuna and tuna-like species (Large Pelagic Fish) Contribution to the 2nd Technical meeting on Sharks of the IATTC, 14-1313 May, La Jolla California, USA BIOLOGICAL
Grupo Bafar with two digit growth in Operating Income and Operation Flow
 THIRD QUARTER RESULTS FOR 2011 Grupo Bafar with two digit growth in Operating Income and Operation Flow Third Quarter 2011 versus Third Quarter 2010 Sales volumes increased by 6.3% Sales increased in 6.1
Tendencias mundiales: Tasa de desempleo Departamento de Estadística de la OIT, Noviembre 2011
 1 / 10 Tendencias mundiales: Tasa de desempleo Tasa de desempleo: Los cambios en el mísmo período del año anterior (puntos porcentuales 1 ) Feb-10 Mar-10 Abr-10 May-10 Jun-10 Jul-10 Ago-10 Sep-10 Oct-10
NINTH MEETING DOCUMENT SAC-09-05
 INTER-AMERICAN TROPICAL TUNA COMMISSION SCIENTIFIC ADVISORY COMMITTEE NINTH MEETING La Jolla, California (USA) 14-18 May 2018 DOCUMENT SAC-09-05 STATUS OF BIGEYE TUNA IN THE EASTERN PACIFIC OCEAN IN 2017
Mortgage Statistics (M) December 2017 and Year Provisional data
 December 2017 and Year Provisional data") 28 February 2018 Mortgage Statistics (M) December 2017 and Year 2017. Provisional data The total number of mortgages constituted on dwellings recorded in the land registries stands at 20,681 in December,
28 February 2018 Mortgage Statistics (M) December 2017 and Year 2017. Provisional data The total number of mortgages constituted on dwellings recorded in the land registries stands at 20,681 in December,
Environmental taxes increased by 3.0% in 2017 reaching 21,382 million euros
 22 November 218 Environmental accounts: Environmental Taxes Account Preview year 217 Environmental taxes increased by 3.% in 217 reaching 21,382 million euros They accounted for 8.2% of total taxes in
DOCUMENT SAC-06-08b UPDATED STOCK STATUS INDICATORS FOR SILKY SHARKS IN THE EASTERN PACIFIC OCEAN ( )
") INTER-AMERICAN TROPICAL TUNA COMMISSION SCIENTIFIC ADVISORY COMMITTEE SIXTH MEETING La Jolla, California (USA) 11-15 May 2015 DOCUMENT SAC-06-08b UPDATED STOCK STATUS INDICATORS FOR SILKY SHARKS IN THE
INTER-AMERICAN TROPICAL TUNA COMMISSION SCIENTIFIC ADVISORY COMMITTEE SIXTH MEETING La Jolla, California (USA) 11-15 May 2015 DOCUMENT SAC-06-08b UPDATED STOCK STATUS INDICATORS FOR SILKY SHARKS IN THE
STATUS OF BIGEYE TUNA IN THE EASTERN PACIFIC OCEAN IN 2013 AND OUTLOOK FOR THE FUTURE
 STATUS OF BIGEYE TUNA IN THE EASTERN PACIFIC OCEAN IN 2013 AND OUTLOOK FOR THE FUTURE Alexandre Aires-da-Silva and Mark N. Maunder This report presents the most current stock assessment of bigeye tuna
Instituto Nacional de Pesca Biblioteca Dra. Lucía Solórzano Constantine
 ESTUDIOS DE LOS DESEMBARQUES DEL CAMARÓN (GEN. PENAEUS) EN EL GOLFO DE GUAYAQUIL (1965 1979) Medardo Cún y Cecilia Marín Resumen.- La información acumulada, sobre las investigaciones del recurso camaronero
Selecting Books for Children Up To Age - : In Response to Psychological vs. Morphological Development
 Selecting Books for Children Up To Age - : In Response to Psychological vs. Morphological Development Yasuko Shirasu Many guidebooks and booklists are available in Japan for those who are interested in
In September, the number of property transfers registered is 123,642 properties, that is, 1.5% less than in the same month of the previous year
 11 November 2014 Statistics on Transfer of Property Rights (STPR) September 2014. Provisional data In September, the number of property transfers registered is 123,642 properties, that is, 1.5% less than
Mortgage Statistics (M) March Provisional data
 March Provisional data") 30 May 2017 Mortgage Statistics (M) March 2017. Provisional data The total number of mortgages constituted on dwellings recorded in the land registries stands at 27,720 in March, 20.2% higher than in the
30 May 2017 Mortgage Statistics (M) March 2017. Provisional data The total number of mortgages constituted on dwellings recorded in the land registries stands at 27,720 in March, 20.2% higher than in the
In December, 6,741 mercantile companies are created, 8.4% less than in the same month of the previous year, and 2,585 are dissolved, 0.
 9 February 2018 Mercantile Companies Statistics (MC) December 2017 and year 2017. Provisional data In December, 6,741 mercantile companies are created, 8.4% less than in the same month of the previous
Jack Mackerel (Trachurus murphyi) spatial distribution and seasonal acoustic biomass estimated in the north of Chile ;
 spatial distribution and seasonal acoustic biomass estimated in the north of Chile ;") Jack Mackerel (Trachurus murphyi) spatial distribution and seasonal acoustic biomass estimated in the north of Chile. - ; - Jorge Castillo, José Córdova Acoustic Data Data was obtain in seasonal acoustic
Jack Mackerel (Trachurus murphyi) spatial distribution and seasonal acoustic biomass estimated in the north of Chile. - ; - Jorge Castillo, José Córdova Acoustic Data Data was obtain in seasonal acoustic
74 Prime Time. conjetura Suposición acerca de un patrón o relación, basada en observaciones.
 A abundant number A number for which the sum of all its proper factors is greater than the number itself. For example, 24 is an abundant number because its proper factors, 1, 2, 3, 4, 6, 8, and 12, add
DATOS ESTADÍSTICOS DE LA PESQUERÍA DE TÚNIDOS DE LAS ISLAS CANARIAS DURANTE EL PERIODO 1975 A 2016
 SCRS/217/183 Collect. Vol. Sci. Pap. ICCAT, 74(5): 1955-1968 (217) DATOS ESTADÍSTICOS DE LA PESQUERÍA DE TÚNIDOS DE LAS ISLAS CANARIAS DURANTE EL PERIODO 1975 A 216 R. Delgado de Molina 1 SUMMARY This
DOCUMENTO SAC-07-06b.i
 COMISIÓN INTERAMERICANA DEL ATÚN TROPICAL COMITÉ CIENTÍFICO ASESOR SÉPTIMA REUNIÓN La Jolla, California (EE.UU.) 09-13 de mayo de 2016 DOCUMENTO SAC-07-06b.i INDICADORES DE CONDICIÓN DE POBLACIÓN ACTUALIZADOS
25ª REUNIÓN DE LAS PARTES DOCUMENTO MOP INFORME PRELIMINAR SOBRE EL PROGRAMA INTERNACIONAL PARA LA CONSERVACION DE LOS DELFINES EN 2011
 ACUERDO SOBRE EL PROGRAMA INTERNACIONAL PARA LA CONSERVACIÓN DE LOS DELFINES 25ª REUNIÓN DE LAS PARTES LA JOLLA, CALIFORNIA (EE.UU.) 19 DE JUNIO DE 2012 DOCUMENTO MOP-25-05 INFORME PRELIMINAR SOBRE EL
COMISIÓN INTERAMERICANA DEL ATÚN TROPICAL COMITÉ CIENTÍFICO ASESOR QUINTA REUNIÓN. La Jolla, California (EE.UU.) de mayo de 2014
 de mayo de 2014") COMISIÓN INTERAMERICANA DEL ATÚN TROPICAL COMITÉ CIENTÍFICO ASESOR QUINTA REUNIÓN La Jolla, California (EE.UU.) 12-16 de mayo de 2014 DOCUMENTO SAC-05-12 EVALUACIÓN DE LA RELACIÓN ENTRE LA CAPACIDAD DE
COMISIÓN INTERAMERICANA DEL ATÚN TROPICAL COMITÉ CIENTÍFICO ASESOR QUINTA REUNIÓN La Jolla, California (EE.UU.) 12-16 de mayo de 2014 DOCUMENTO SAC-05-12 EVALUACIÓN DE LA RELACIÓN ENTRE LA CAPACIDAD DE
DATOS ESTADÍSTICOS DE LA PESQUERÍA DE TÚNIDOS DE LAS ISLAS CANARIAS DURANTE EL PERIODO 1975 A 2015
 SCRS/216/126 Collect. Vol. Sci. Pap. ICCAT, 73(2): 737-748 (217) DATOS ESTADÍSTICOS DE LA PESQUERÍA DE TÚNIDOS DE LAS ISLAS CANARIAS DURANTE EL PERIODO 1975 A 215 Rosa Delgado de Molina 1 SUMMARY This
La pesquería de pescadilla
 Vol. 21, 51-56 (2010) La pesquería de pescadilla en el Uruguay ERNESTO CHIESA Dirección Nacional de Recursos Aucáticos i e-mail: echiesa@dinara.gub.uy RESUMEN. La pescadilla (Cynoscion guatucupa) ocupa
EN United in diversity EN A8-0204/83. Amendment
 27.6.2018 A8-0204/83 83 Recital 2 (2) So far, and unless otherwise provided for in national law, the rules on access to the occupation of road transport operator do not apply to undertakings engaged in
In March, 9,271 mercantile companies are created, 12.1% less than in the same month of 2017 and 1,752 are dissolved, 12.0% less
 10 May 2018 Mercantile Companies Statistics (MC) March 2018. Provisional data In March, 9,271 mercantile companies are created, 12.1% less than in the same month of 2017 and 1,752 are dissolved, 12.0%
COMISIÓN INTERAMERICANA DEL ATÚN TROPICAL 85ª REUNIÓN LOS ATUNES Y PECES PICUDOS EN EL OCÉANO PACÍFICO ORIENTAL EN 2012
 COMISIÓN INTERAMERICANA DEL ATÚN TROPICAL 85ª REUNIÓN Veracruz, Veracruz (México) 10-14 de junio de 2013 DOCUMENTO IATTC-85-03 LOS ATUNES Y PECES PICUDOS EN EL OCÉANO PACÍFICO ORIENTAL EN 2012 A. La pesquería
Pregunta 1 Suponga que una muestra de 35 observaciones es obtenida de una población con media y varianza. Entonces la se calcula como.
 Universidad de Costa Rica Programa de Posgrado en Computación e Informática Doctorado en Computación e Informática Curso Estadística 18 de febrero 2013 Nombre: Segundo examen corto de Probabilidad Pregunta
INSTITUTO ESPAÑOL DE OCEANOGRAFÍA (Tunidos y especies afines (Grandes Pelágicos Oceánicos)
") Ministerio de Educación y Ciencia INSTITUTO ESPAÑOL DE OCEANOGRAFÍA (Tunidos y especies afines (Grandes Pelágicos Oceánicos) Bilateral Scientific and Technical Committee Santiago de Chile, 28-29 September
Ministerio de Educación y Ciencia INSTITUTO ESPAÑOL DE OCEANOGRAFÍA (Tunidos y especies afines (Grandes Pelágicos Oceánicos) Bilateral Scientific and Technical Committee Santiago de Chile, 28-29 September
ACTIVIDADES DEL PERSONAL Y PLAN DE INVESTIGACIONES STAFF ACTIVITIES AND RESEARCH PLAN (SAC 08 10a) 92 a Reunión de la CIAT
 92 a Reunión de la CIAT") ACTIVIDADES DEL PERSONAL Y PLAN DE INVESTIGACIONES STAFF ACTIVITIES AND RESEARCH PLAN (SAC 08 10a) 92 a Reunión de la CIAT 92 nd Meeting of the IATTC PROGRAMA DE INVESTIGACIÓN DE LA CIAT IATTC RESEARCH
ACTIVIDADES DEL PERSONAL Y PLAN DE INVESTIGACIONES STAFF ACTIVITIES AND RESEARCH PLAN (SAC 08 10a) 92 a Reunión de la CIAT 92 nd Meeting of the IATTC PROGRAMA DE INVESTIGACIÓN DE LA CIAT IATTC RESEARCH
DOCUMENT SAC-01-INF-A SUSCEPTIBILITY MEASURES DERIVED FROM FISHERIES OBSERVER DATA
 INTER-AMERICAN TROPICAL TUNA COMMISSION SCIENTIFIC ADVISORY COMMITTEE 1 ST MEETING La Jolla, California (USA) 31 August - 3 September 2010 DOCUMENT SAC-01-INF-A SUSCEPTIBILITY MEASURES DERIVED FROM FISHERIES
BOLETÍN CIENTÍFICO Y TÉCNICO
 ISSN: 1390-4884 Instituto Nacional de Pesca Biblioteca Dra. Lucía Solórzano Constantine BOLETÍN CIENTÍFICO Y TÉCNICO LA PESQUERÍA DEL RECURSO CONCHA Anadara tuberculosa Y Anadara similis EN LOS PRINCIPALES
In May, 8,830 mercantile companies are created, 0.5% more than in the same month of 2017 and 1,522 are dissolved, 0.8% more
 10 July 2018 Mercantile Companies Statistics (MC) May 2018. Provisional data In May, 8,830 mercantile companies are created, 0.5% more than in the same month of 2017 and 1,522 are dissolved, 0.8% more
Market Highlights
 1. Domestic Market Capitalization US$ Milllions Market Highlights - 2009 Last update 02/10/2010 Country Year end 2009 Year end 2008 % Change Brazil 1.337.247,68 591.965,55 125,90% Spain 1.297.226,92 948.352,29